Visualization#
Visualization supports single model evaluation results and multi-model comparison, as well as visualization of mixed dataset evaluations.
Install Dependencies#
Install the dependencies required for visualization, including gradio, plotly, etc.
pip install 'evalscope[app]'
Note
Visualization requires evalscope version greater than or equal to 0.10.0. If the version is less than 0.10.0, please upgrade evalscope first.
Start Visualization Service#
Run the following command to start the visualization service.
evalscope app
You can access the visualization service in the browser if the following output appears.
* Running on local URL:  http://127.0.0.1:7861

To create a public link, set `share=True` in `launch()`.
Features Introduction#
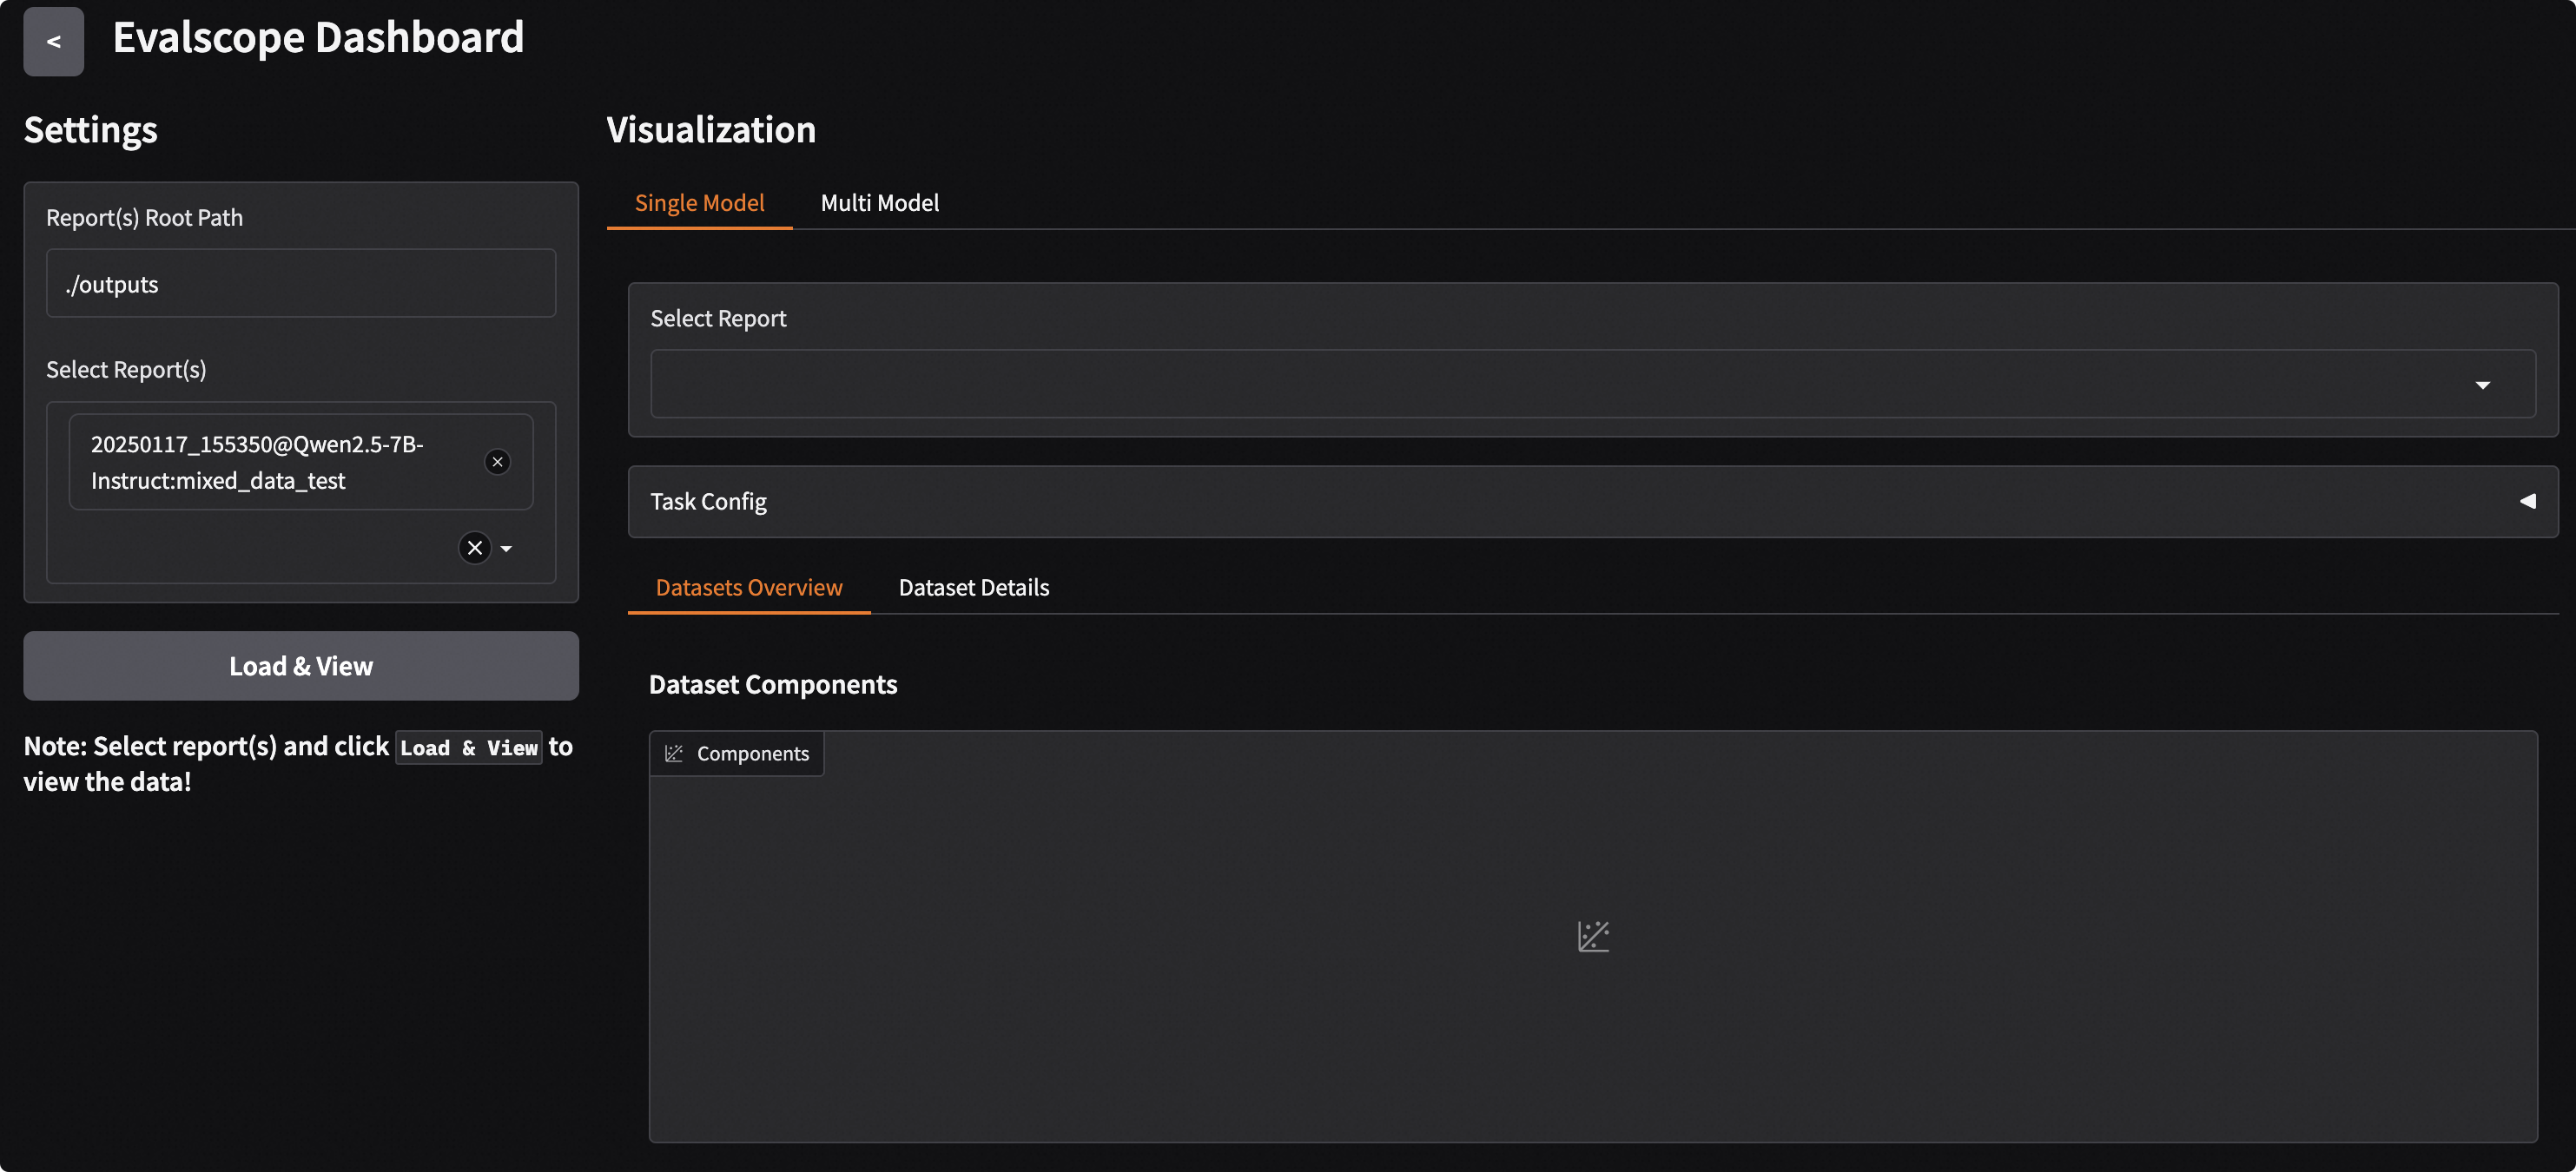
Configuration options on the left:
Root directory of evaluation reports
Selection of evaluation reports
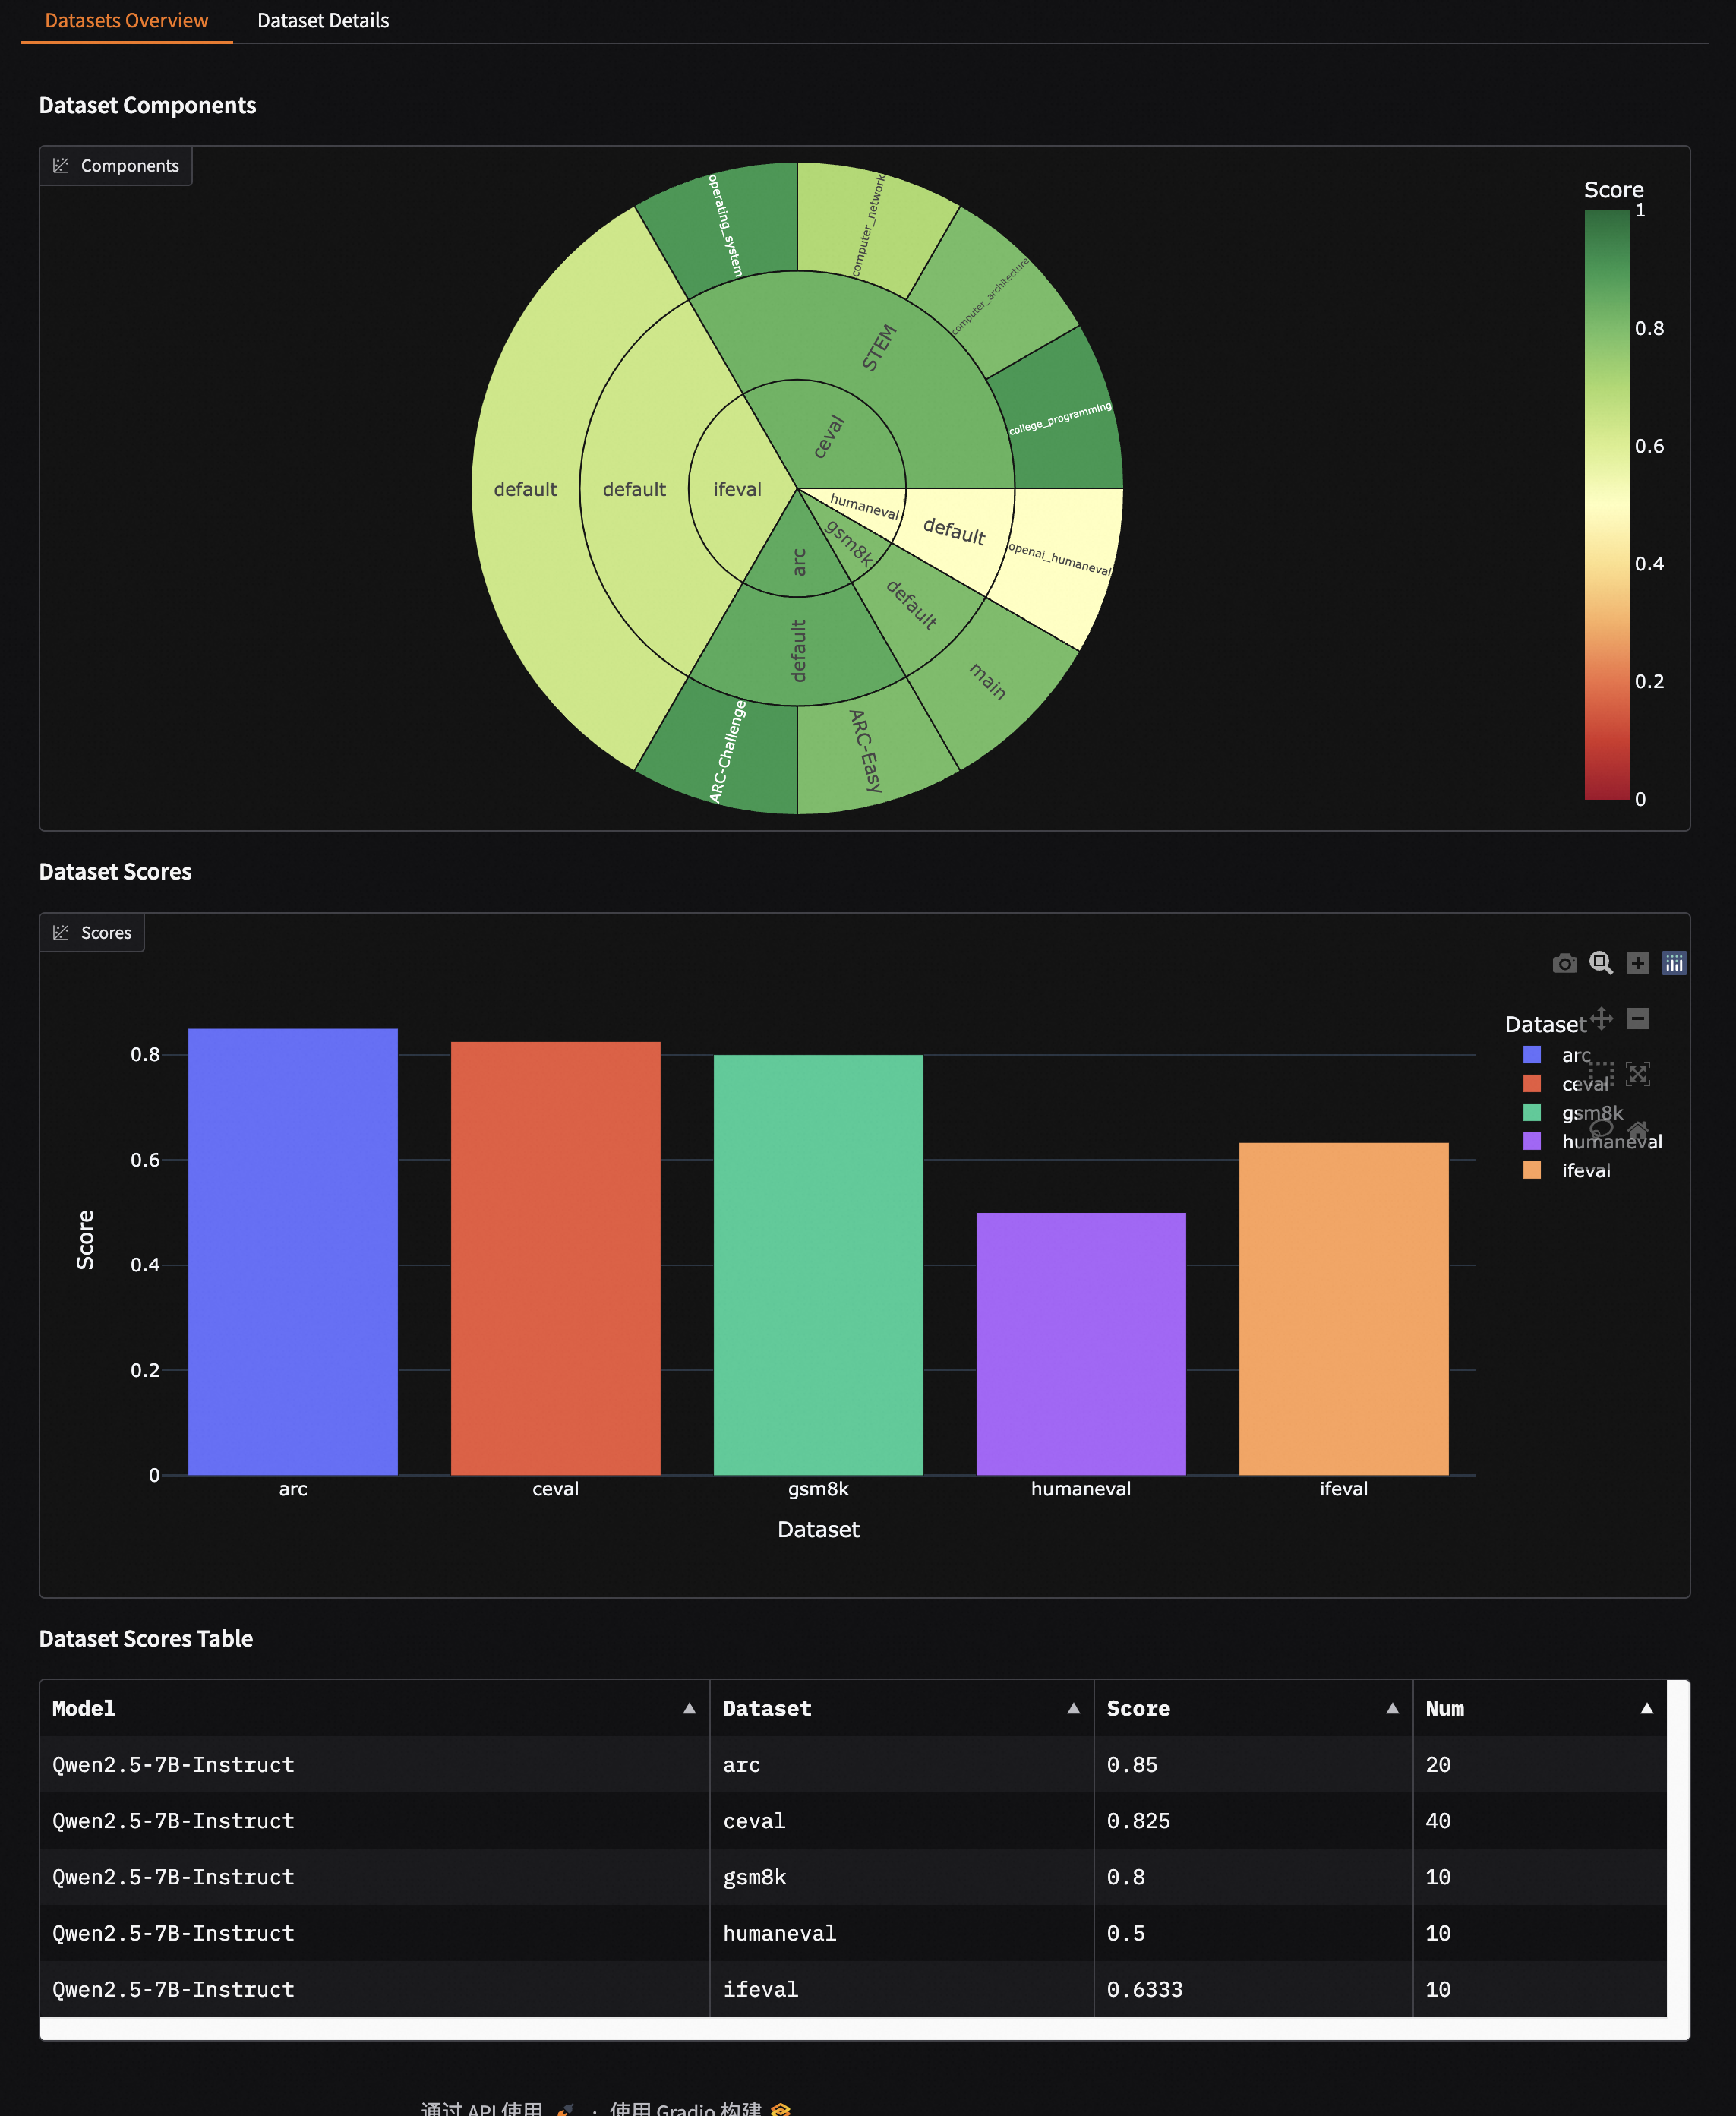
Single Model Evaluation Results:
Evaluation Overview: Displays the composition of the evaluation dataset and the evaluation results
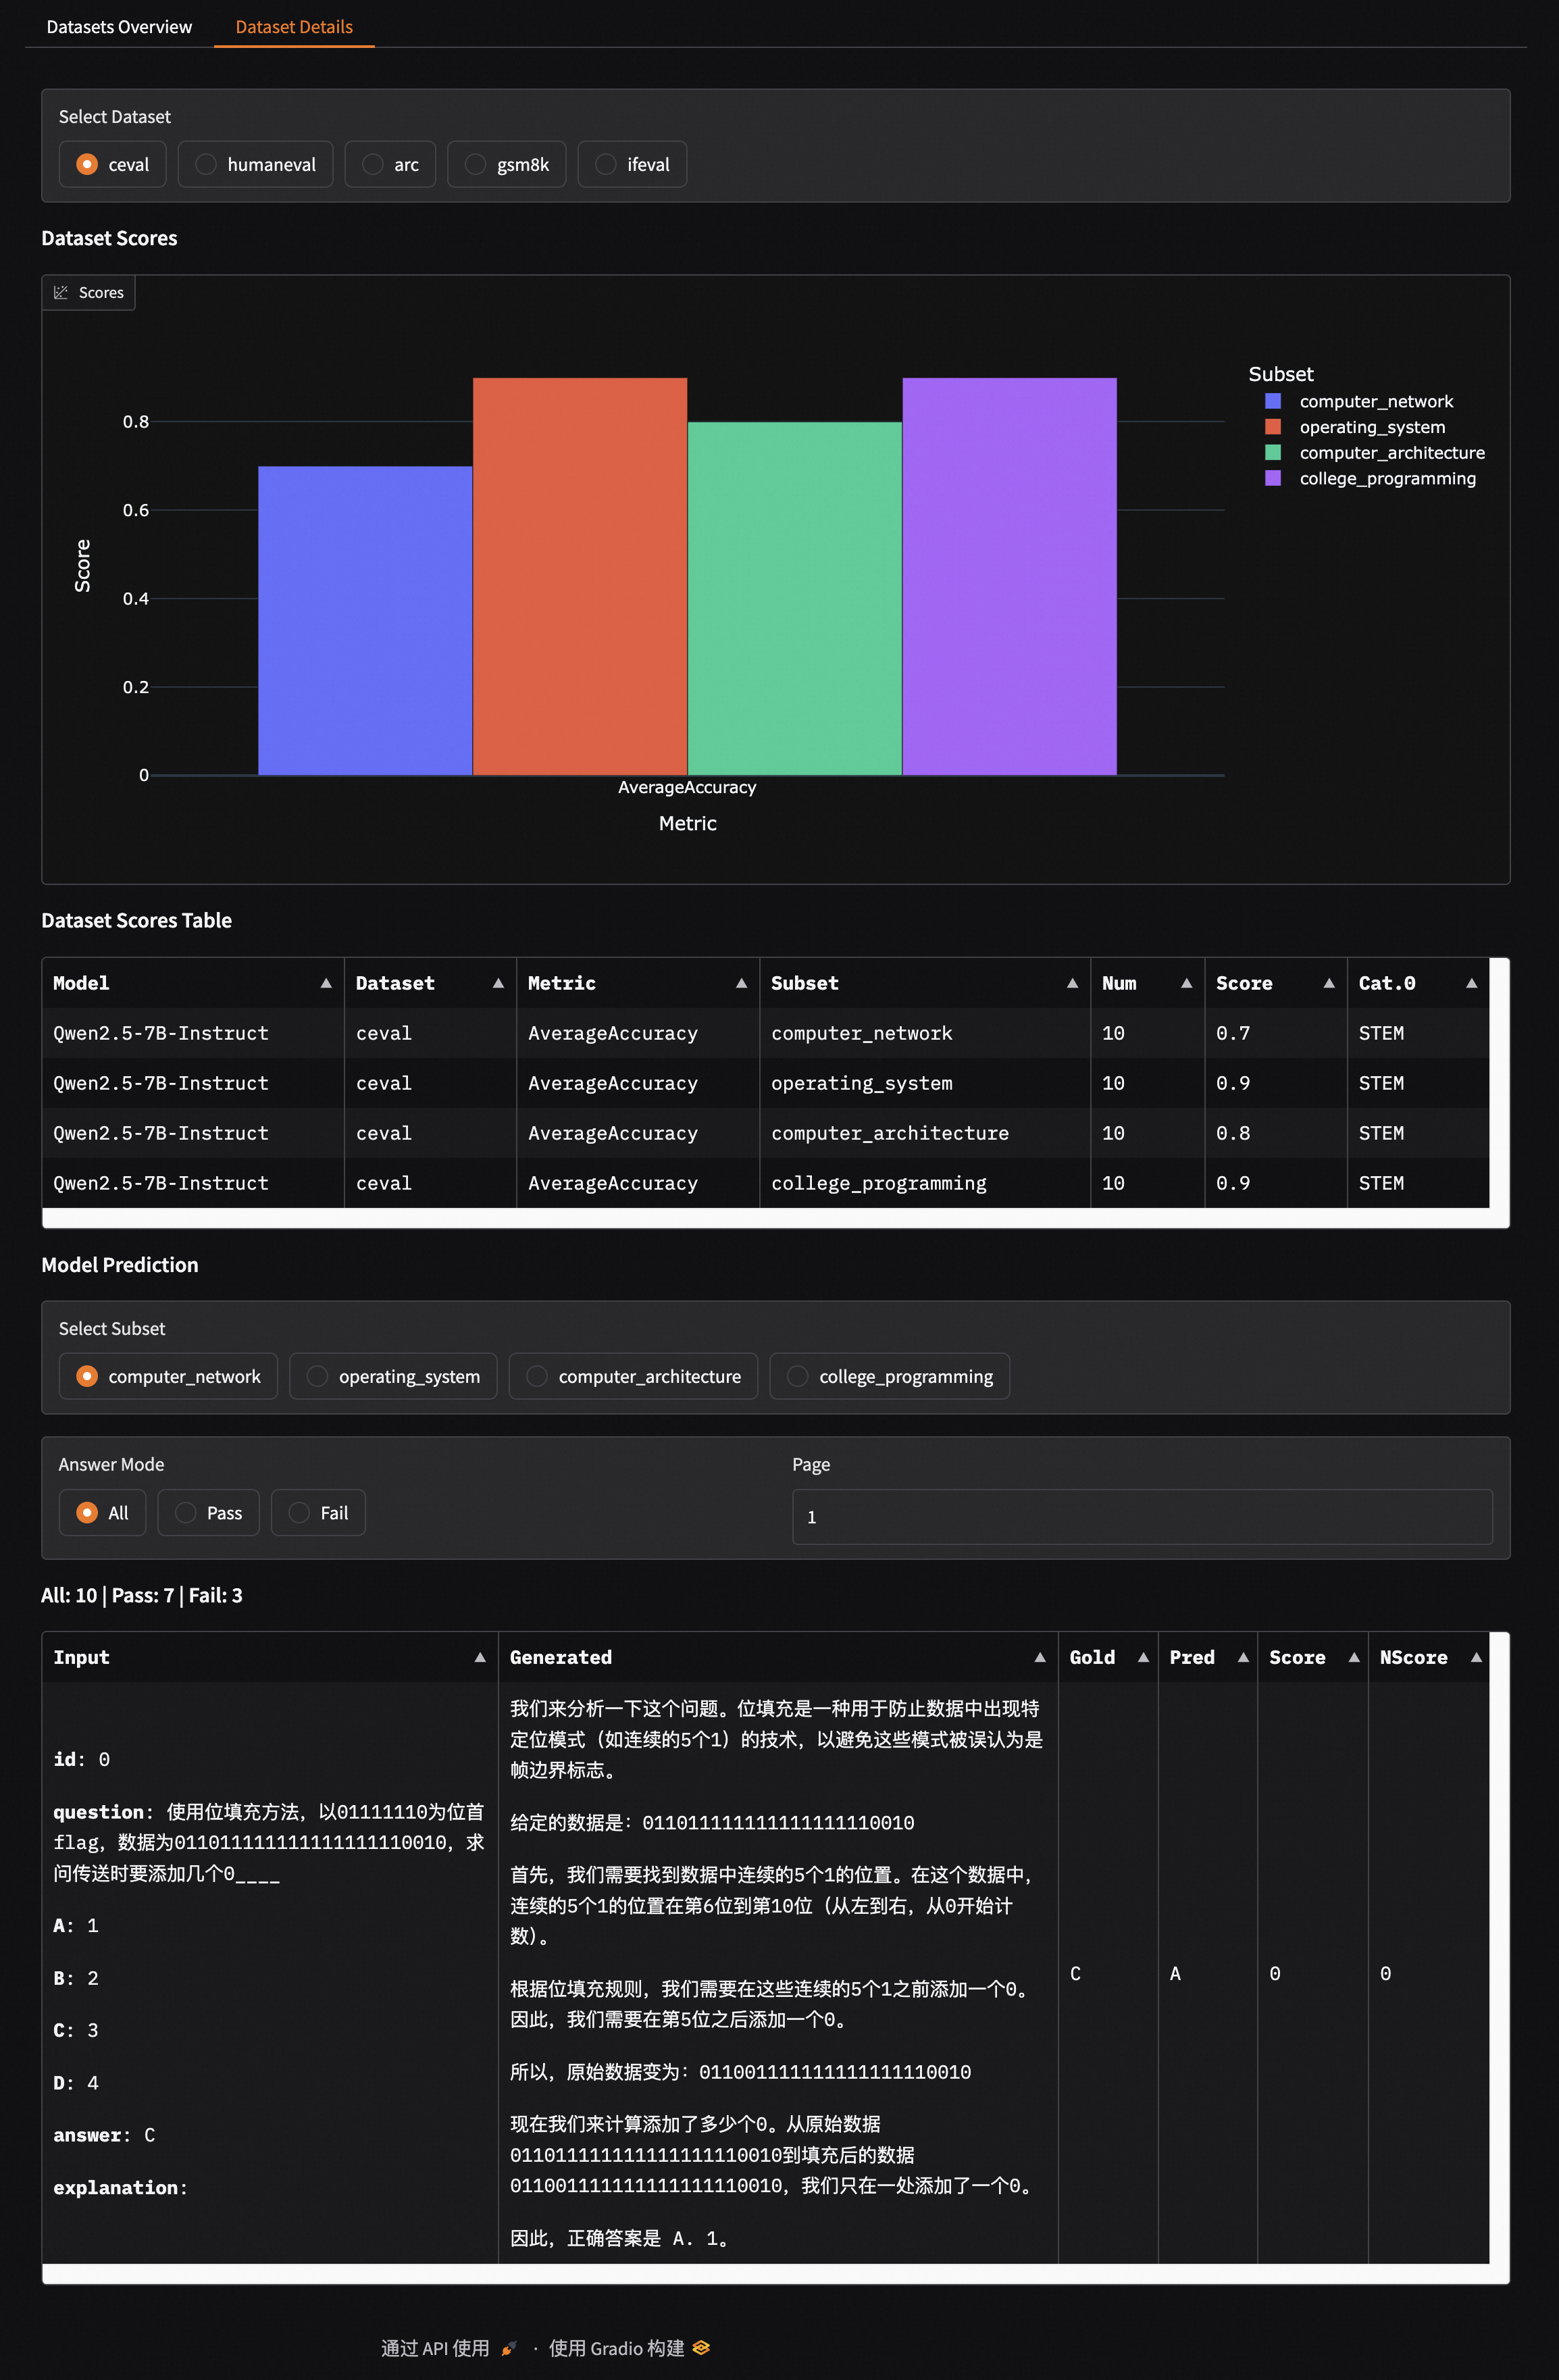
Detailed evaluation of a single dataset, including model prediction results
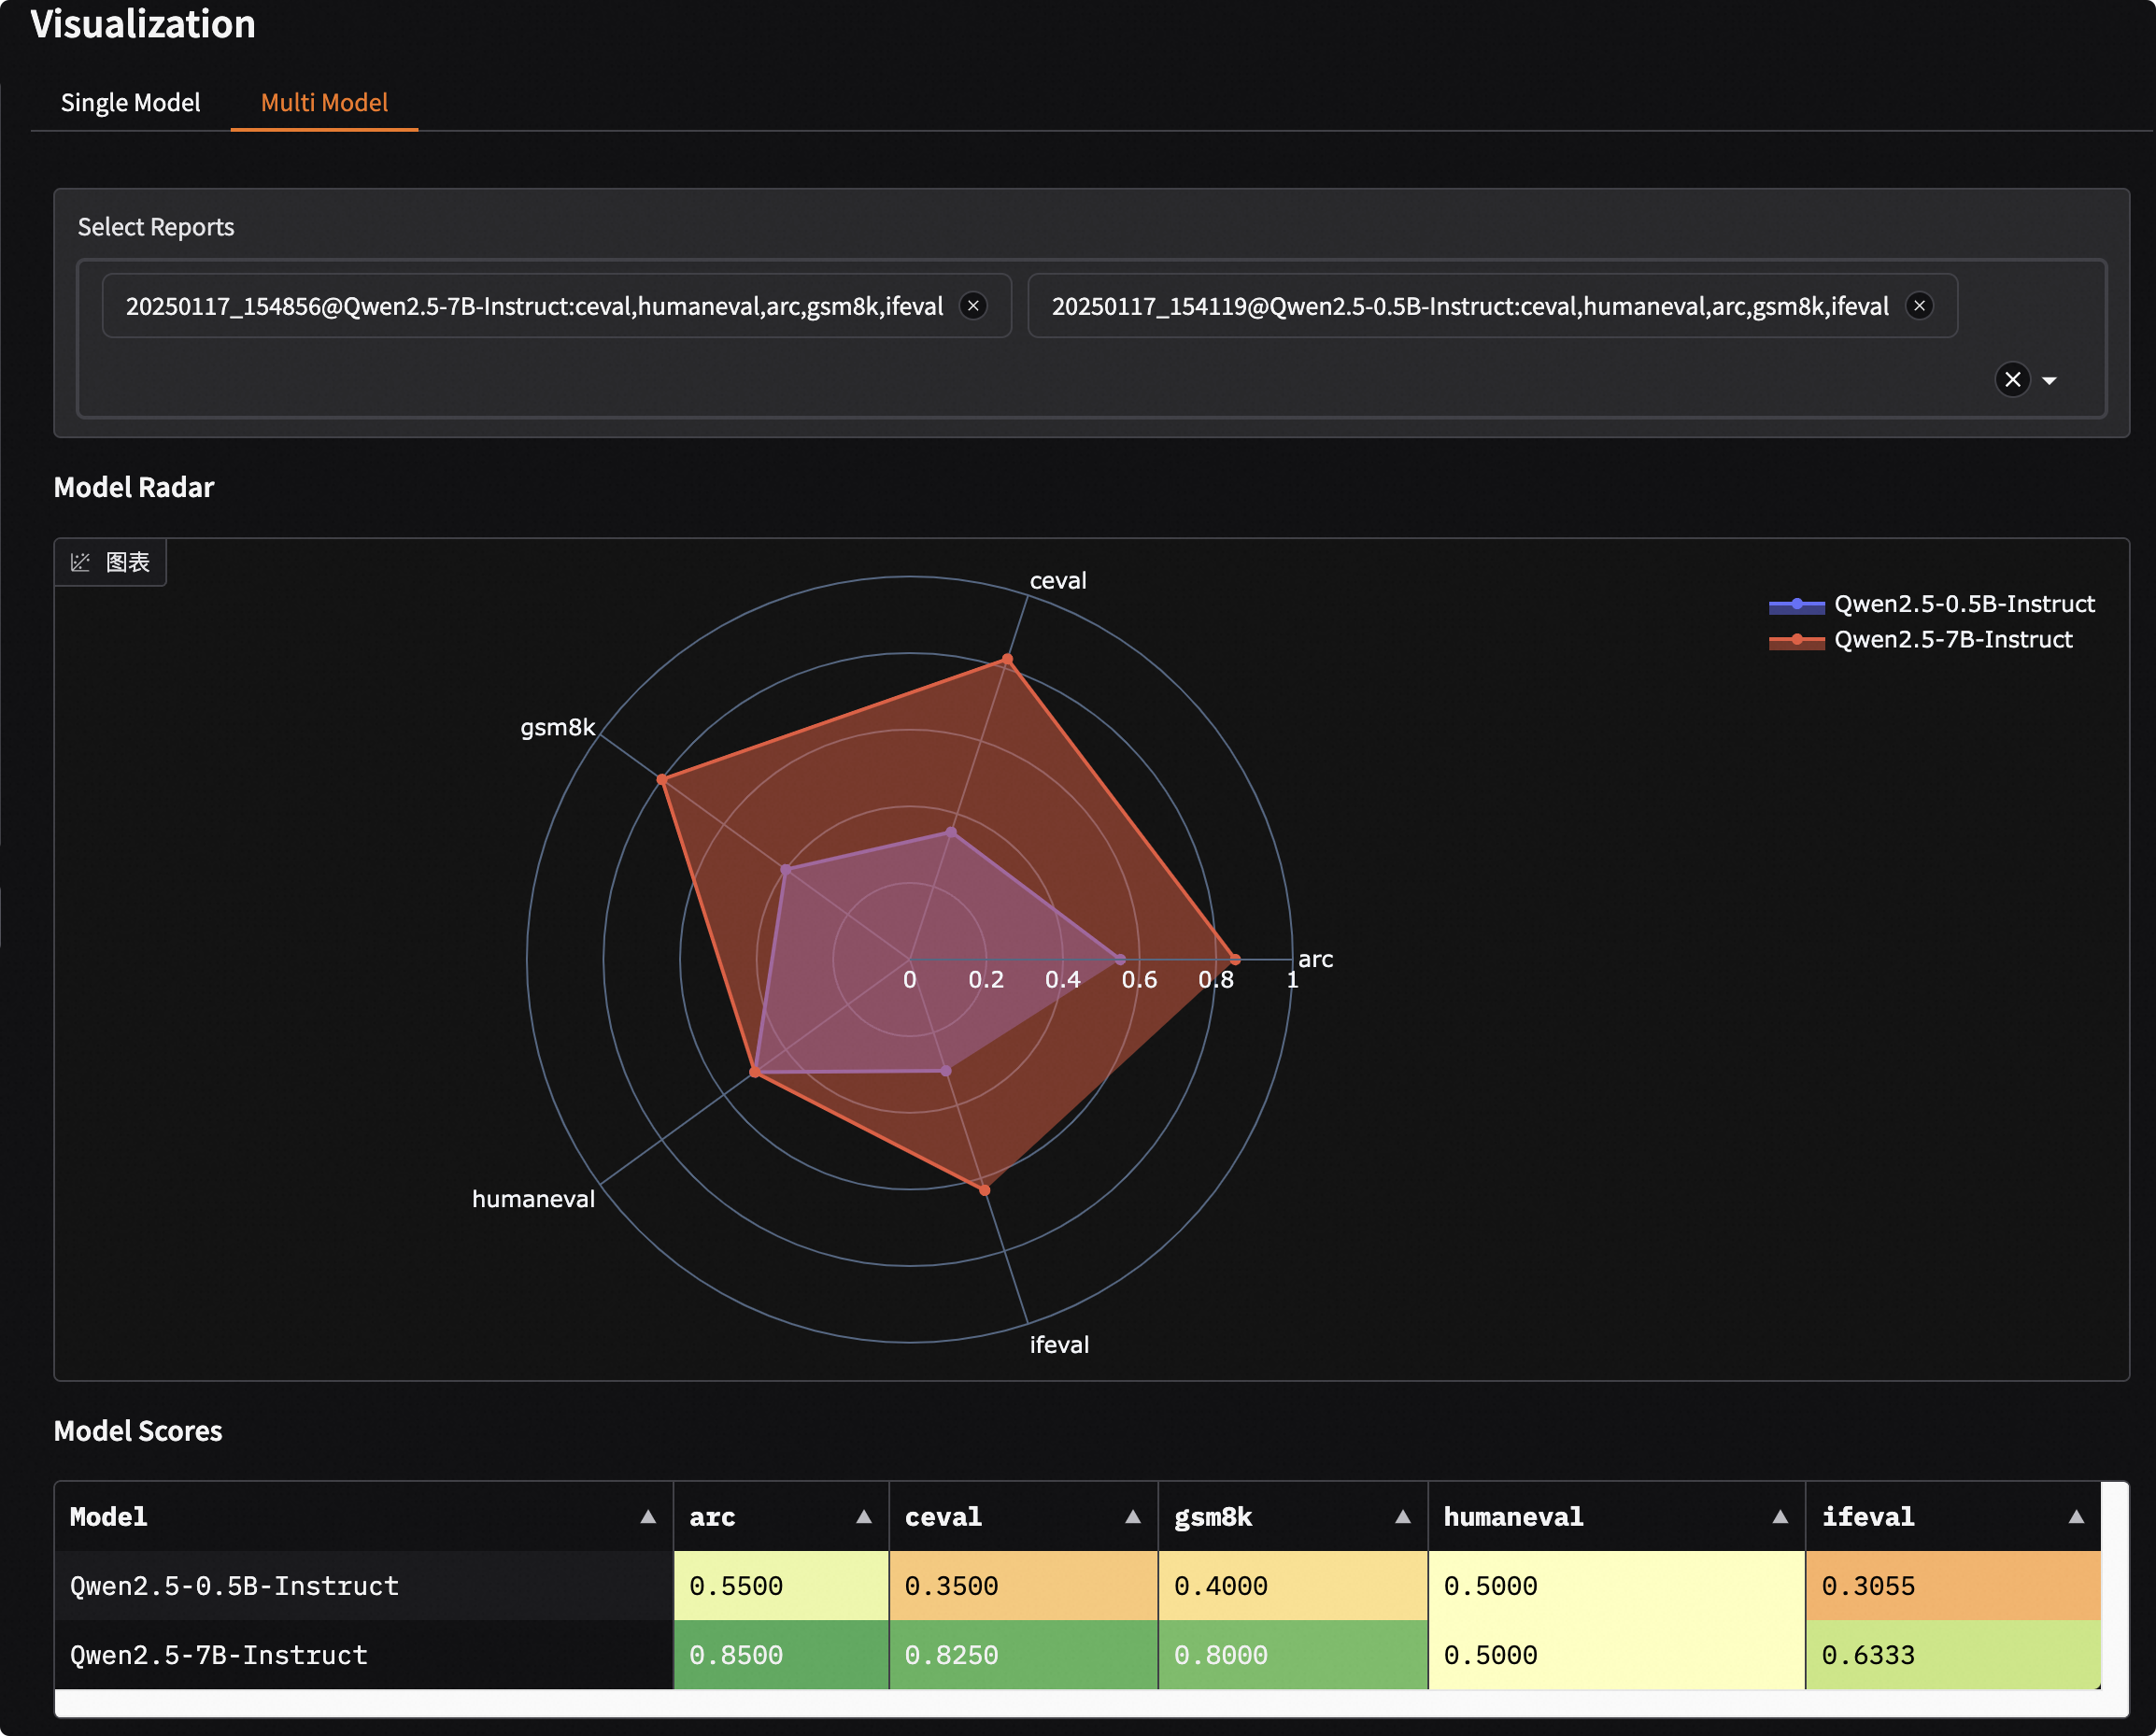
Comparison of Multiple Model Evaluation Results:
Displayed using radar charts and comparison tables
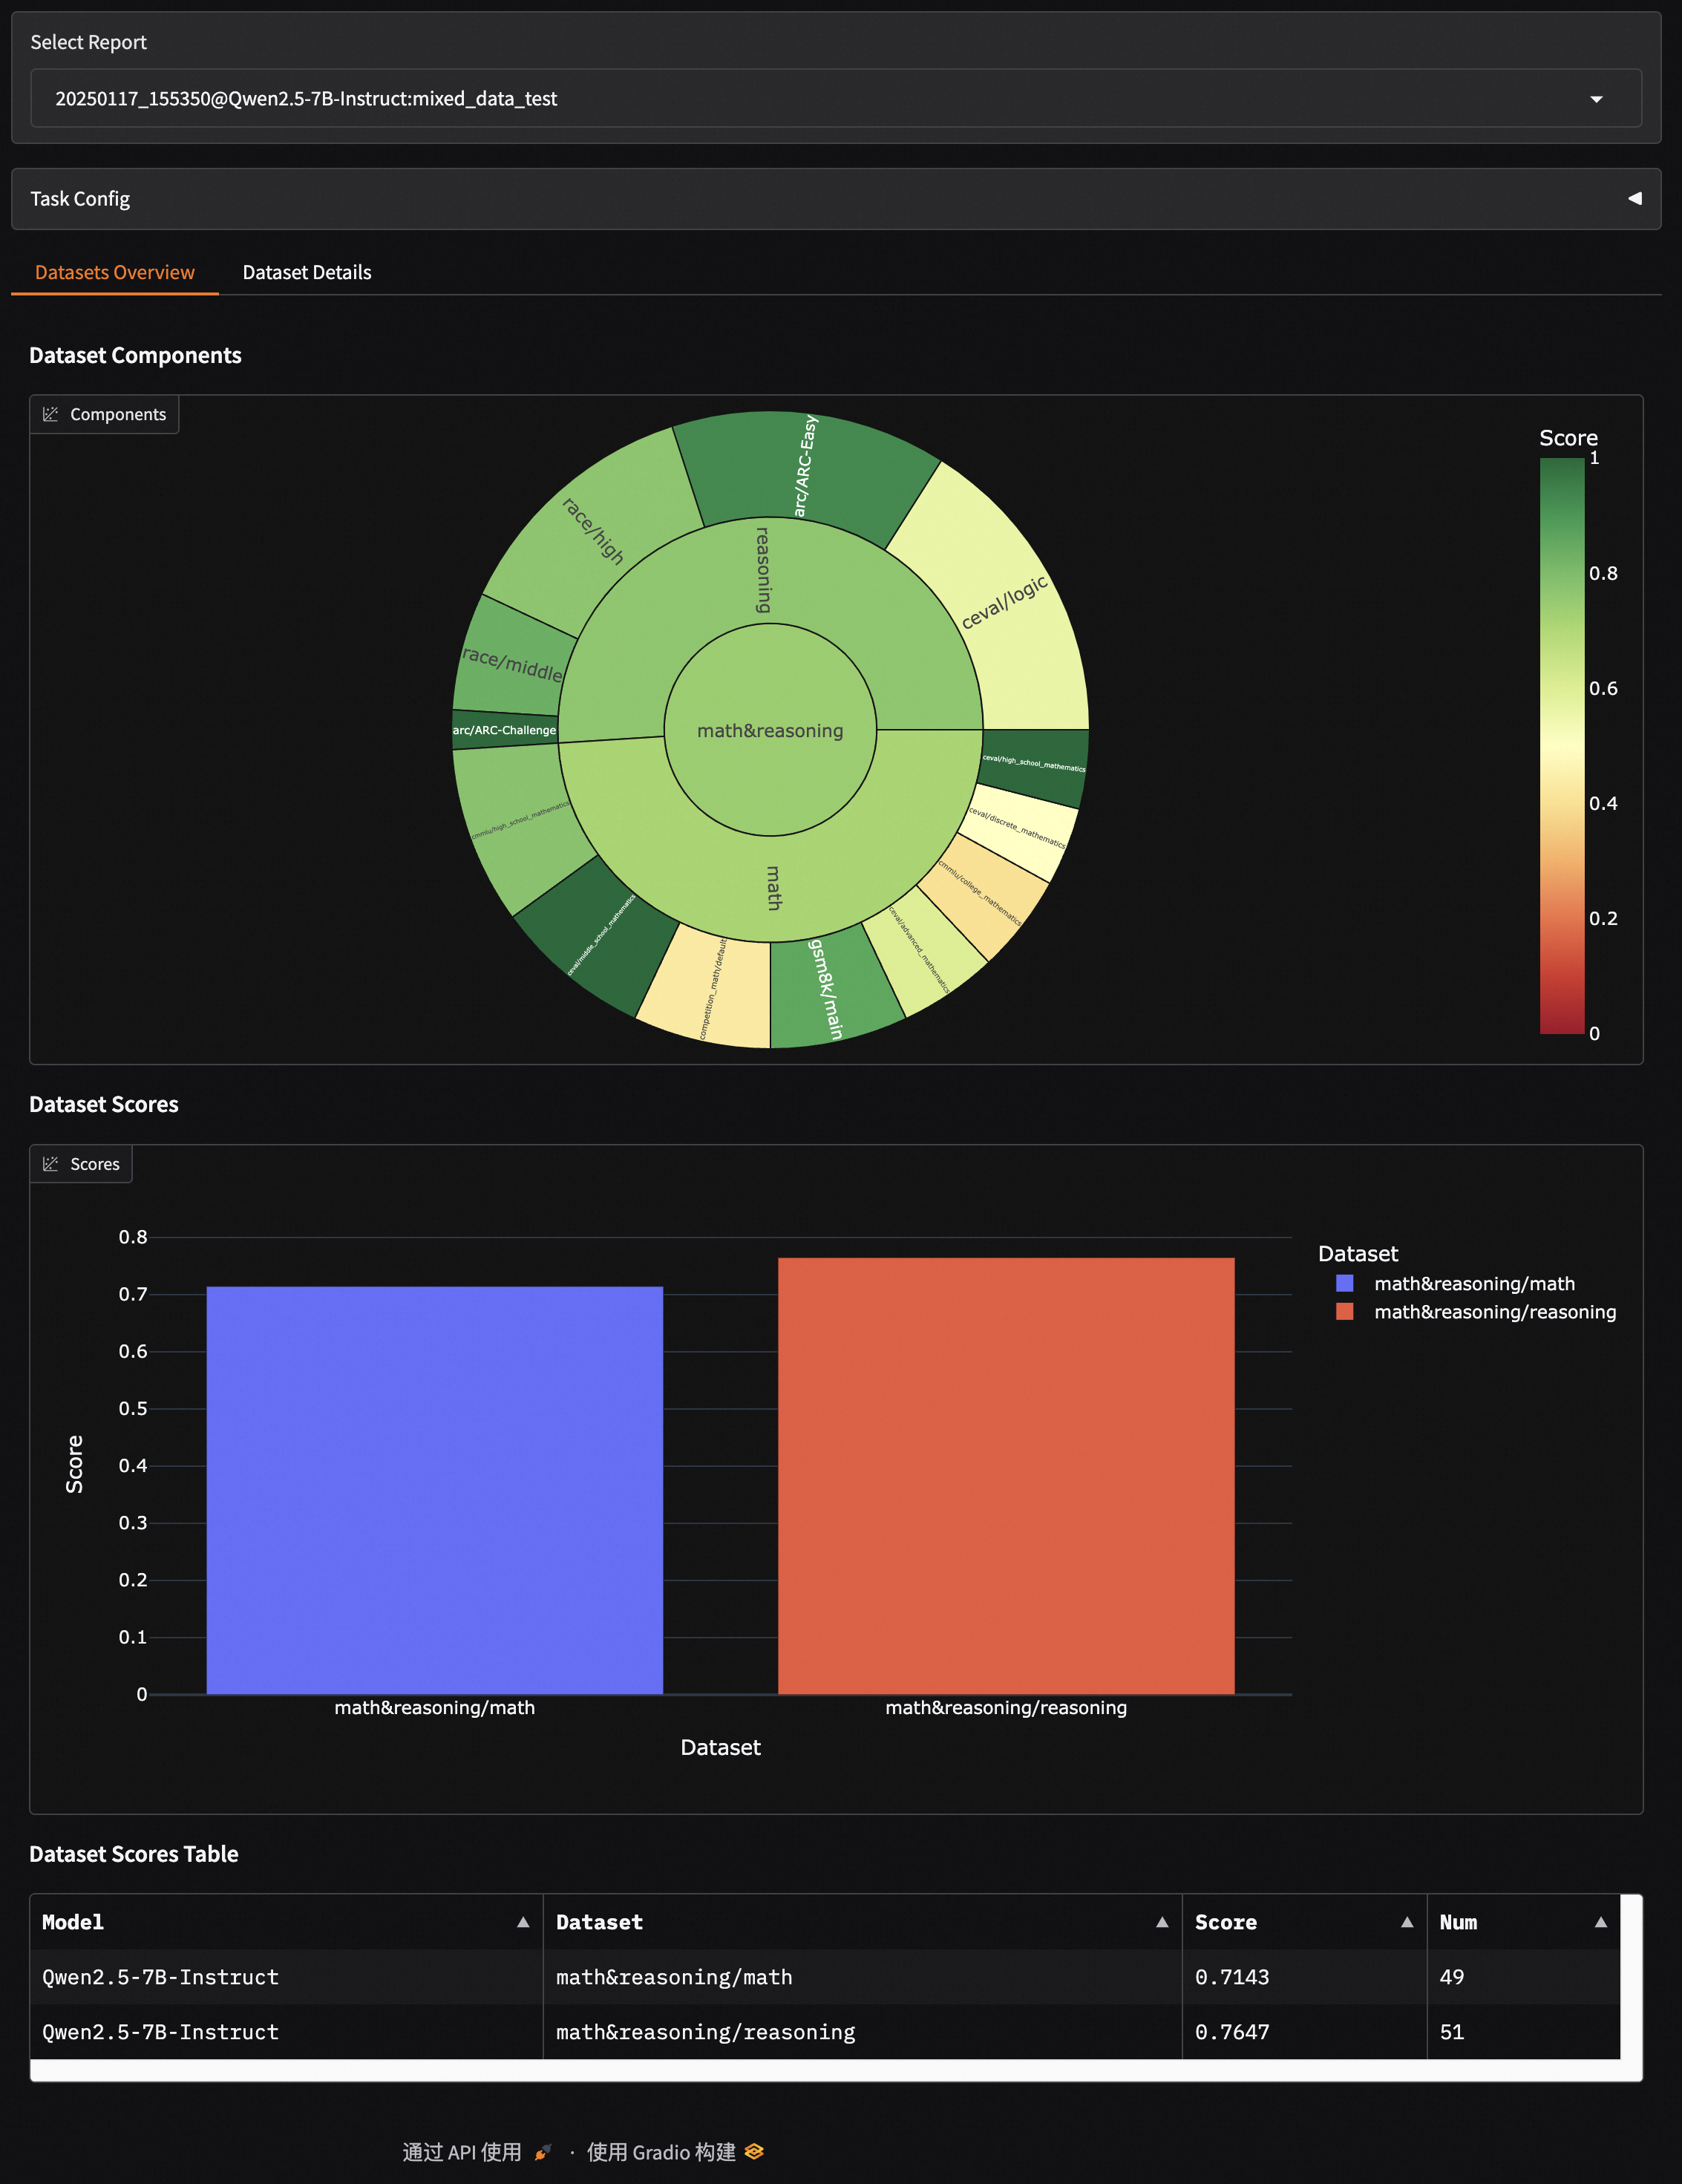
Visualization of Mixed Dataset Evaluations:
Visual representation based on model capability dimensions