Visualization#
The visualization feature supports in-depth analysis and comparison of evaluation results for single or multiple models, and is compatible with displaying mixed dataset evaluations.
Important
This visualization tool is specifically designed for displaying model evaluation results and is not suitable for model stress test results. For visualizing stress test reports, please refer to the Stress Test Result Visualization Guide.
Installation and Startup#
1. Install Dependencies#
Install the required dependencies for visualization.
pip install 'evalscope[app]' -U
Note
The visualization feature requires evaluation reports generated by evalscope>=0.10.0. If your version is too old, please upgrade first and re-run the evaluation.
2. Start Service#
Run the following command to start the visualization web service.
evalscope app
After the service starts, open http://127.0.0.1:7860 in your browser to access it.
Supported command line parameters:
--outputs: Root directory for evaluation reports, default is./outputs.--lang: Interface language, supportszh(default) anden.--share: Create a publicly accessible link.--server-name: Server listening address, default is0.0.0.0.--server-port: Server port, default is7860.
Quick Experience#
We provide an evaluation sample containing multiple models and datasets to help you quickly experience the visualization features.
git clone https://github.com/modelscope/evalscope
evalscope app --outputs evalscope/examples/viz
This sample contains evaluation results of Qwen2.5-0.5B and Qwen2.5-7B models on C-Eval, HumanEval, ARC, GSM8K and other datasets.
Feature Introduction#
Select Evaluation Report#
Follow the steps shown in the image below to select and load evaluation reports:
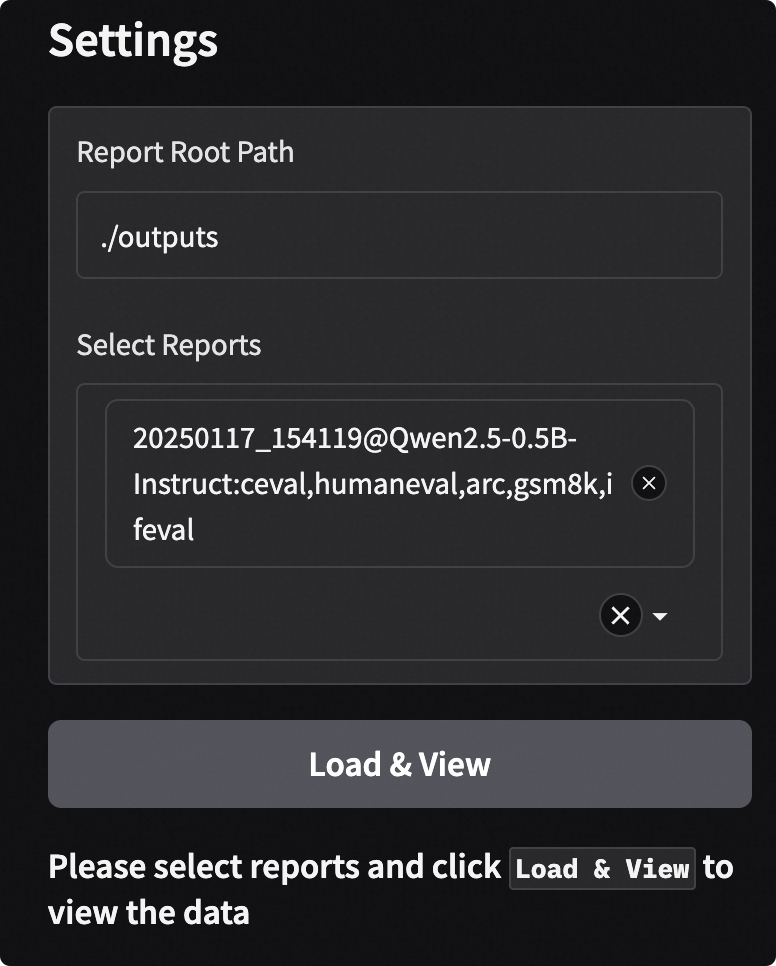
Input Root Directory: Specify the root directory where evaluation reports are located, default is
./outputs. The program will automatically scan all reports in this directory.Select Reports: Choose one or more evaluation reports from the dropdown menu.
Load and View: Click the
Load and Viewbutton to start analysis.
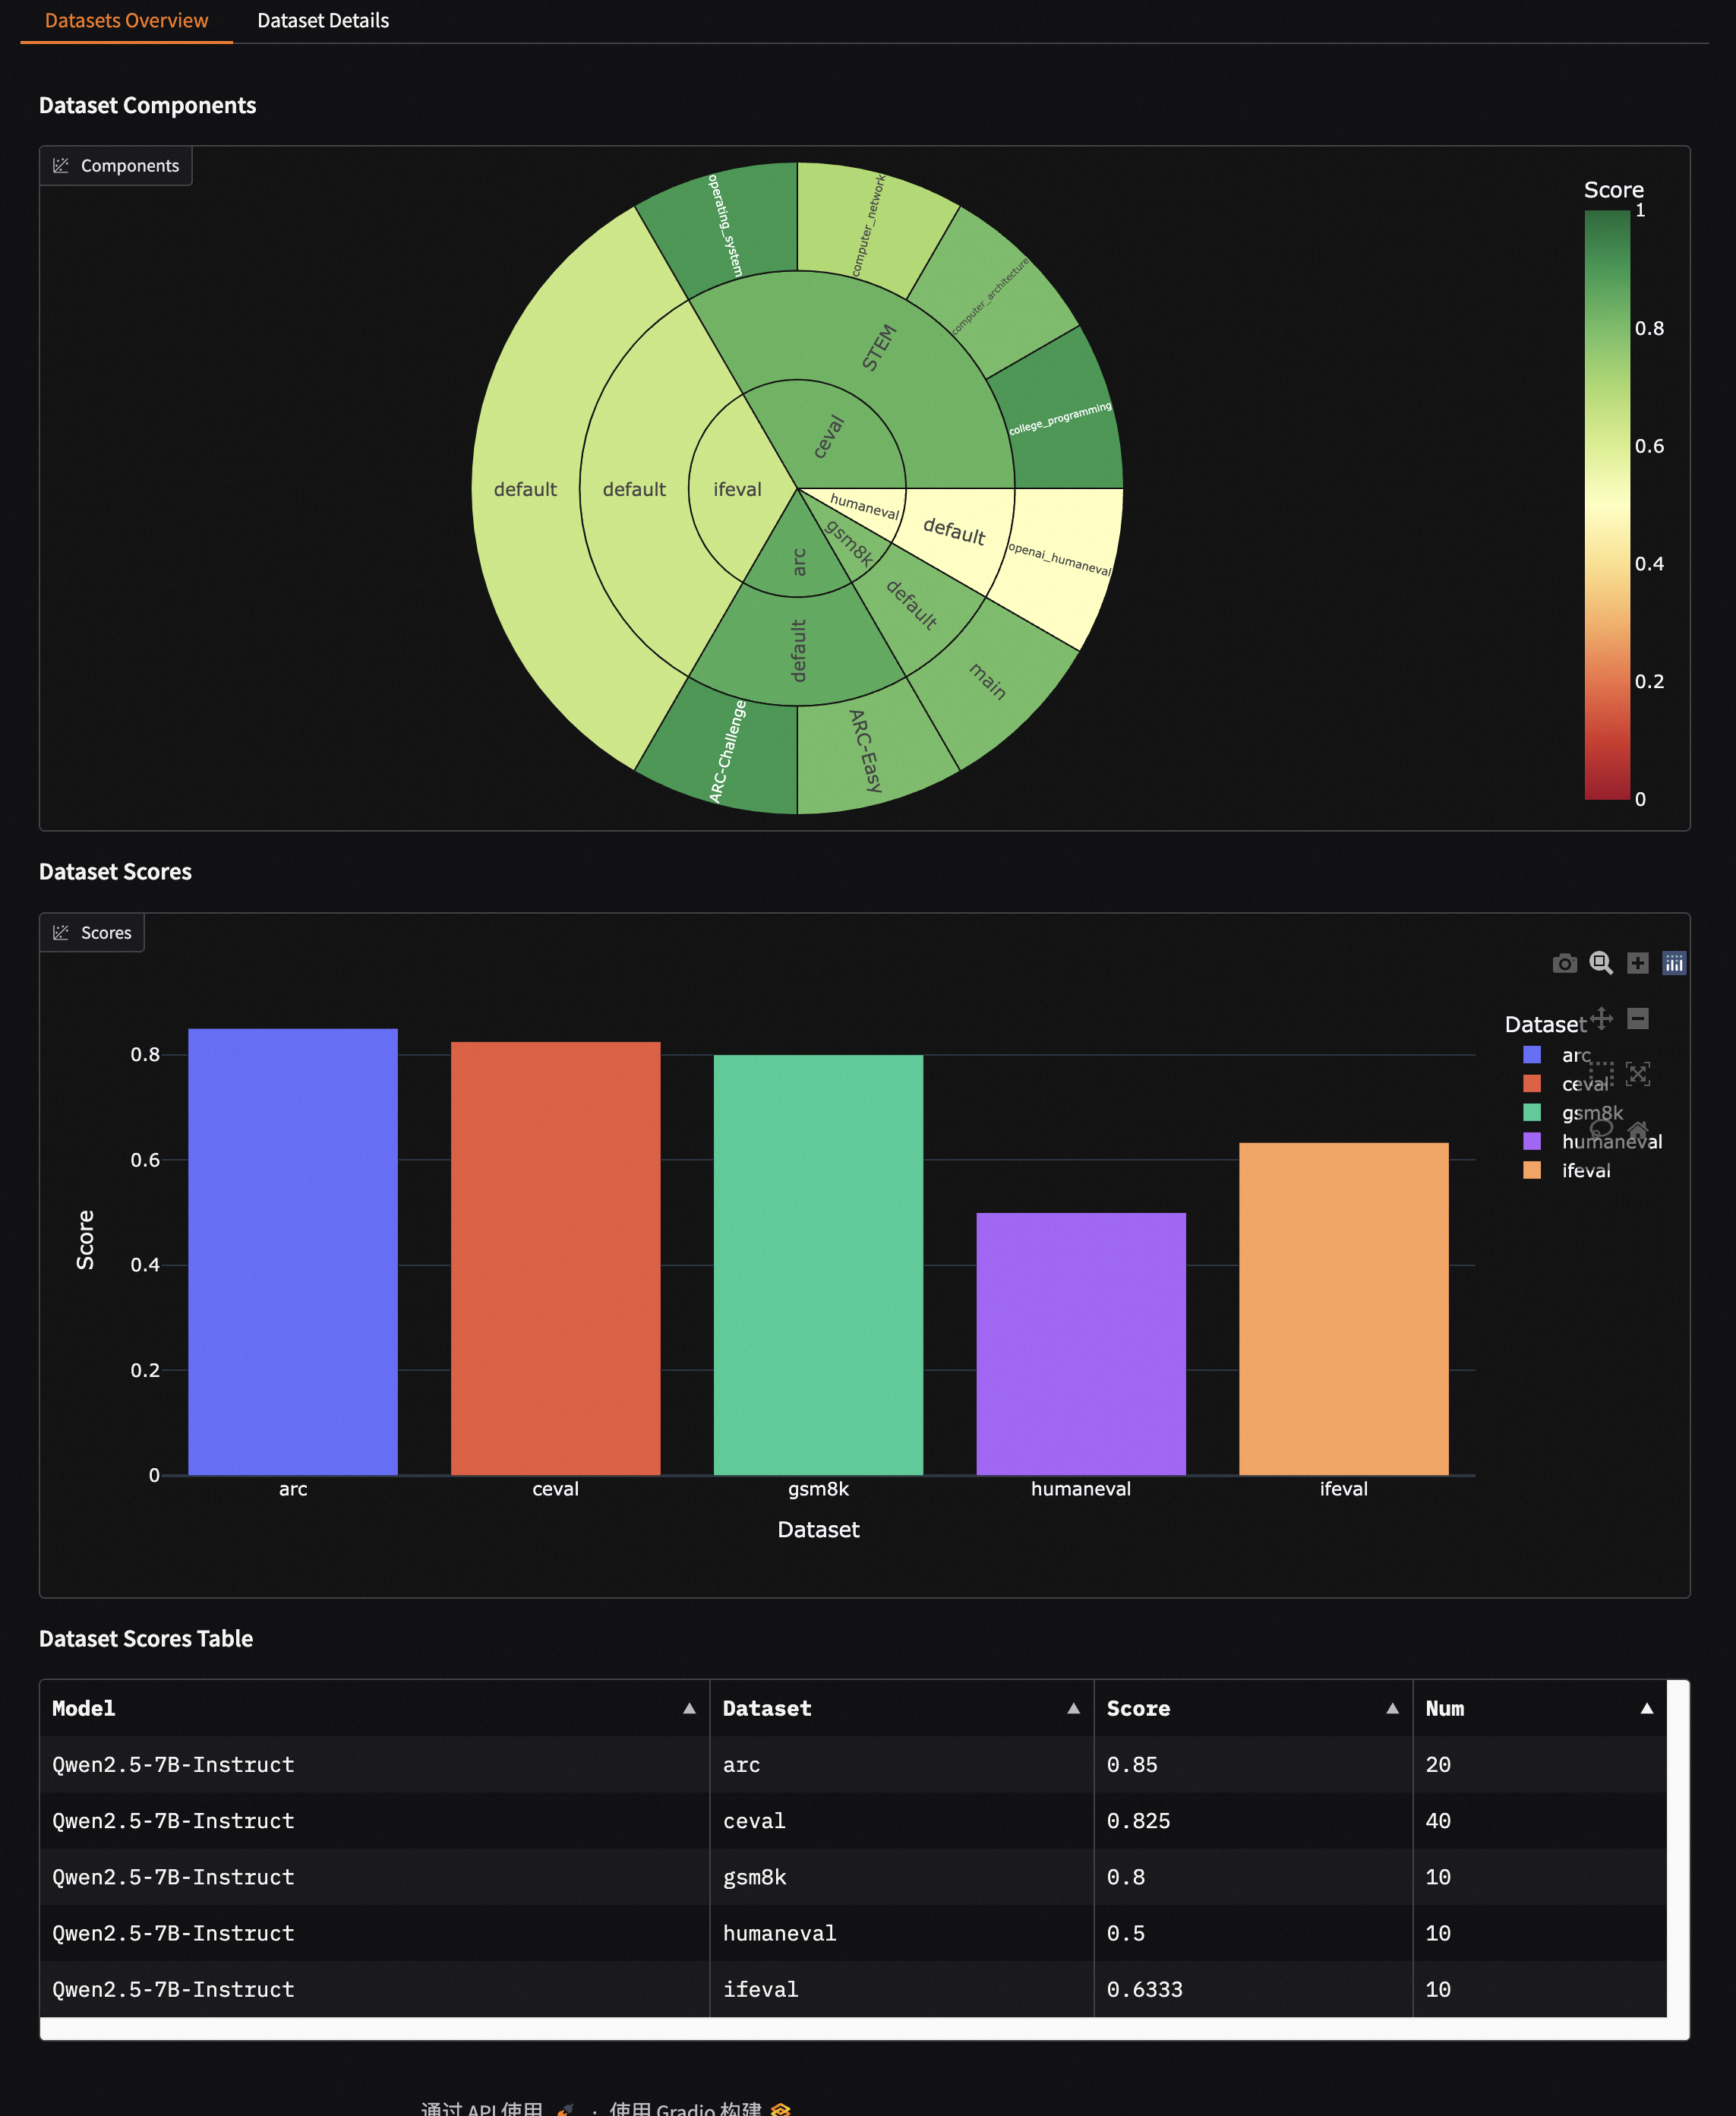
Single Model Evaluation Results#
In the “Single Model” tab, you can perform in-depth analysis of a single model’s performance.
Dataset Overview: Through sunburst charts and tables, intuitively display the model’s overall performance across all evaluation datasets. Each layer of the sunburst chart represents datasets, categories, and subsets respectively, with sector size indicating sample volume and color depth representing score levels.
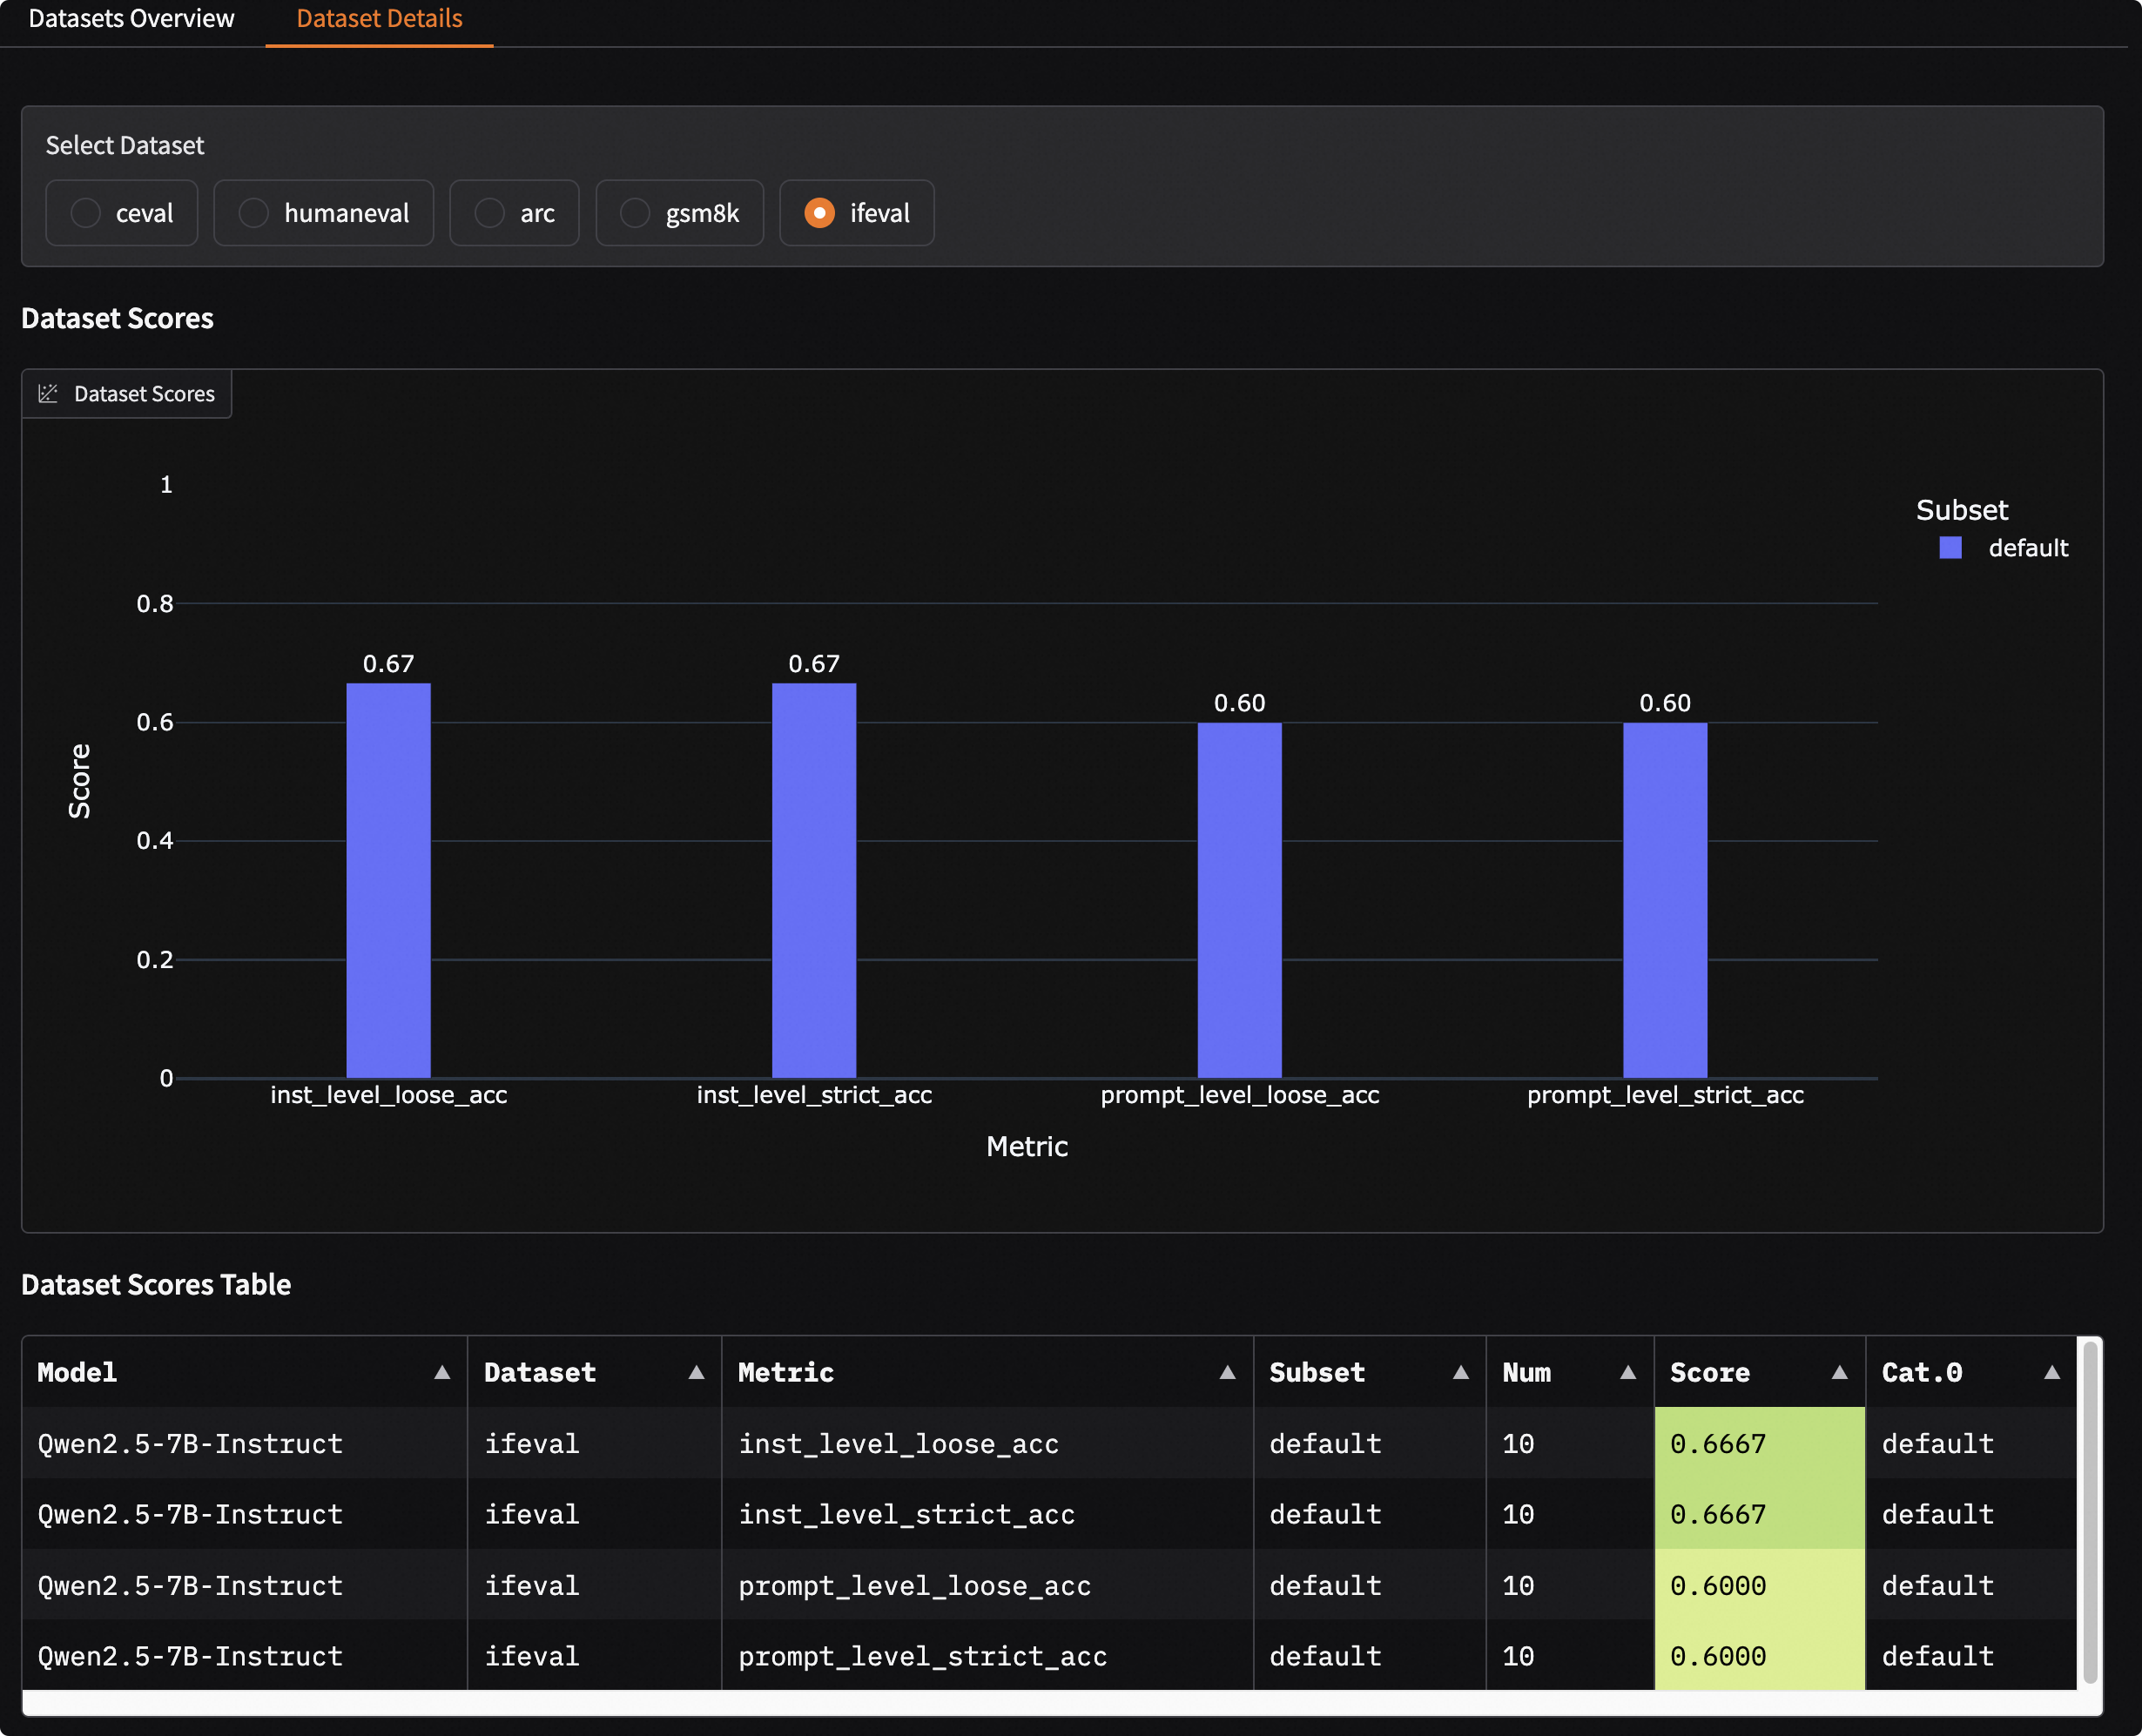
Dataset Details: After selecting a specific dataset, you can view the model’s scores on different metrics and subsets for that dataset. You can also further filter to view detailed input, model output (Generated), standard answer (Gold), and final score for each sample.
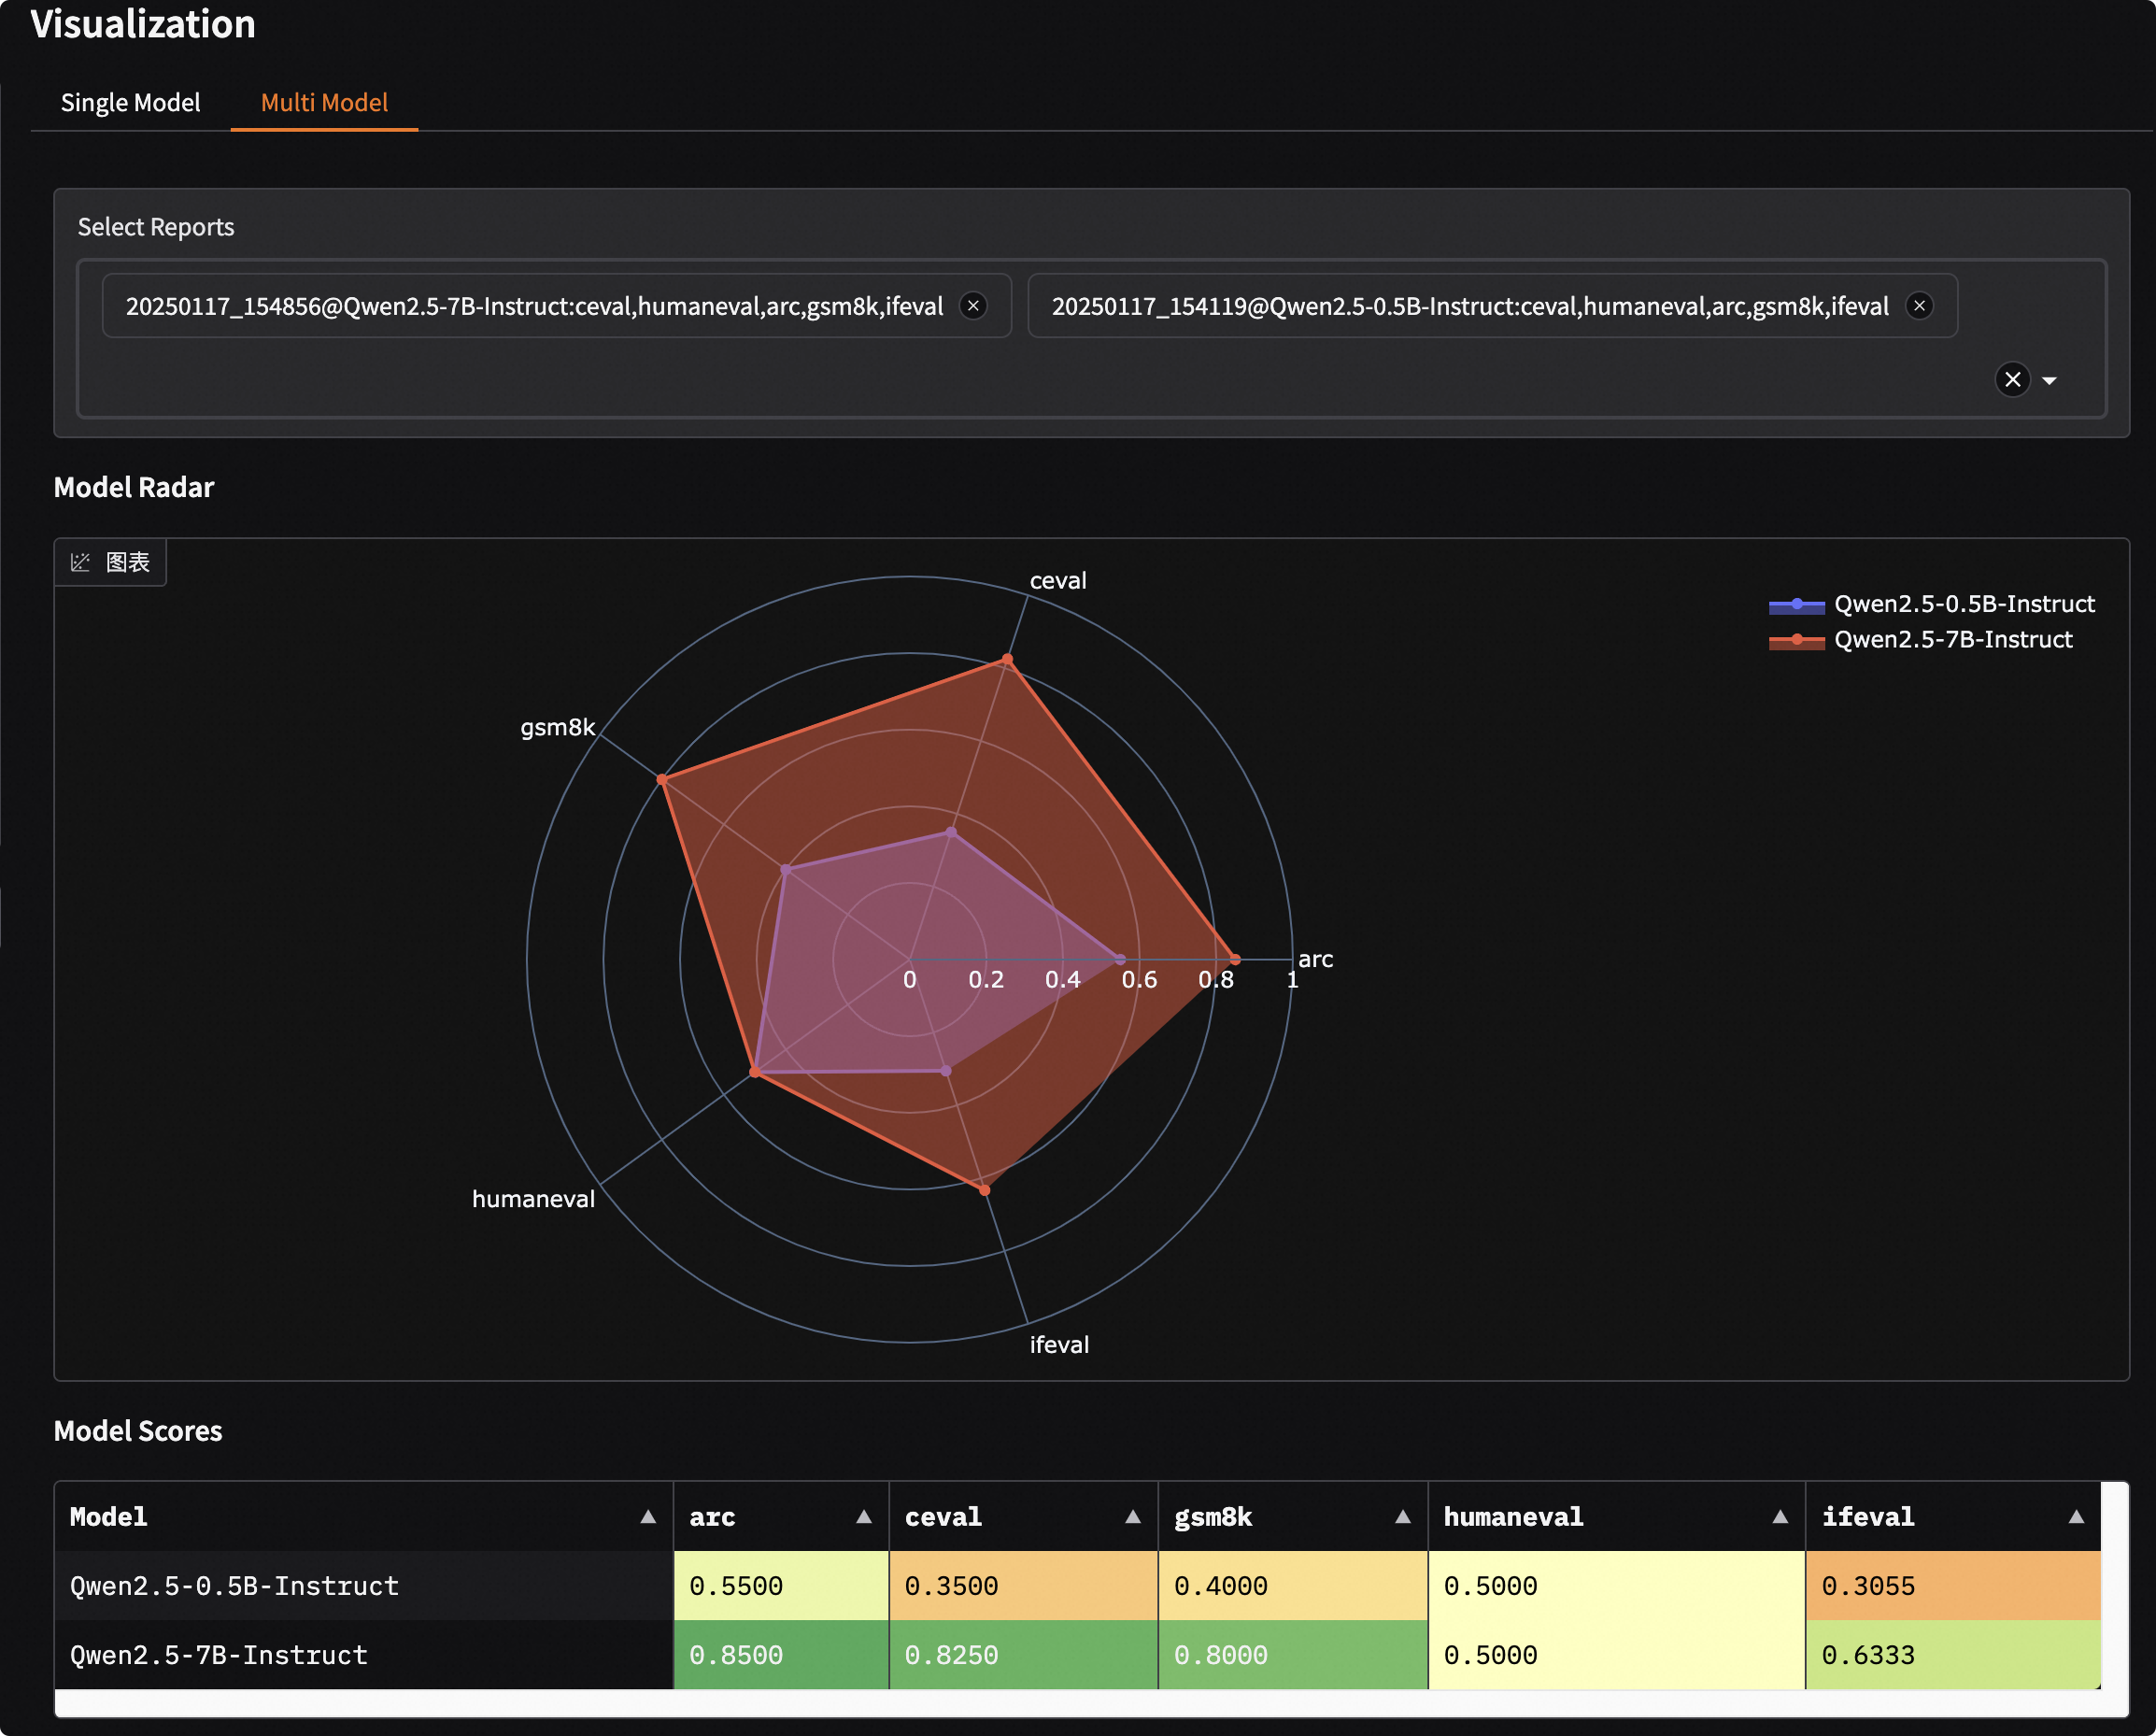
Multi-Model Evaluation Result Comparison#
In the “Multi-Model” tab, you can horizontally compare the performance of multiple models.
Model Overview: Through radar charts and comparison tables, quickly understand the strengths and weaknesses of each model across different capability dimensions.
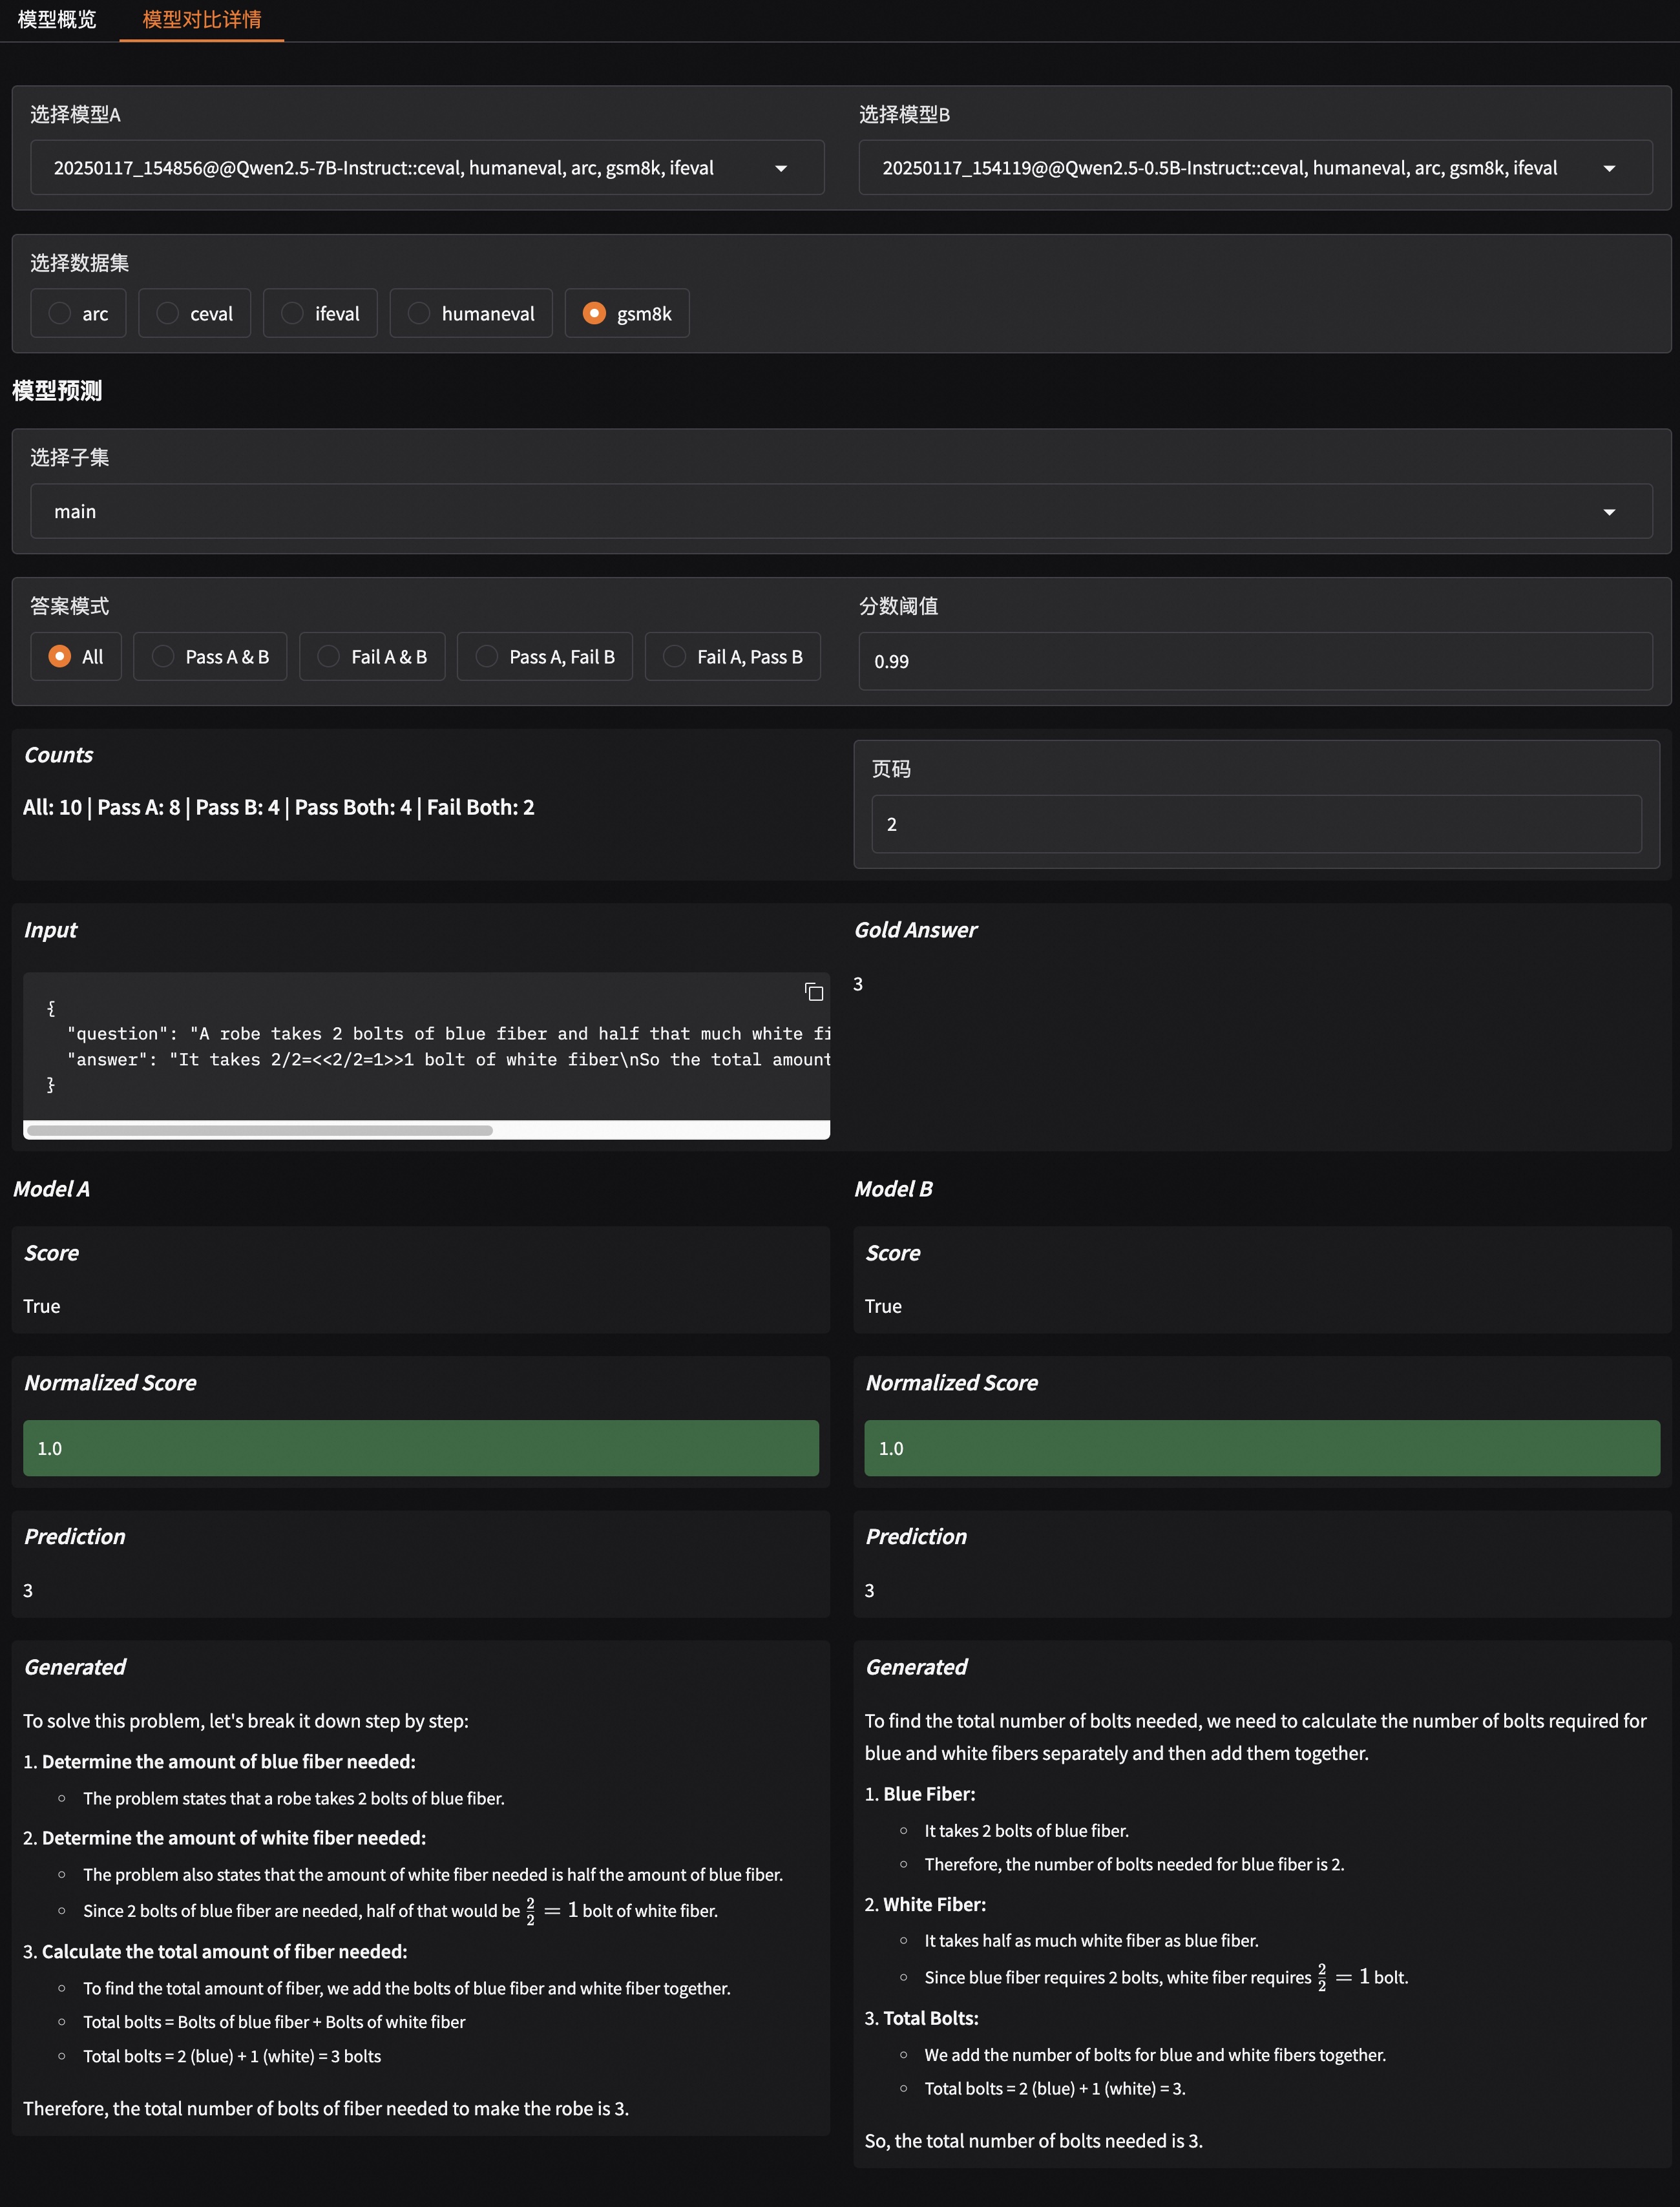
Model Comparison Details: Select two models for “one-on-one” comparison, viewing their specific performance differences side-by-side on the same dataset and same questions.
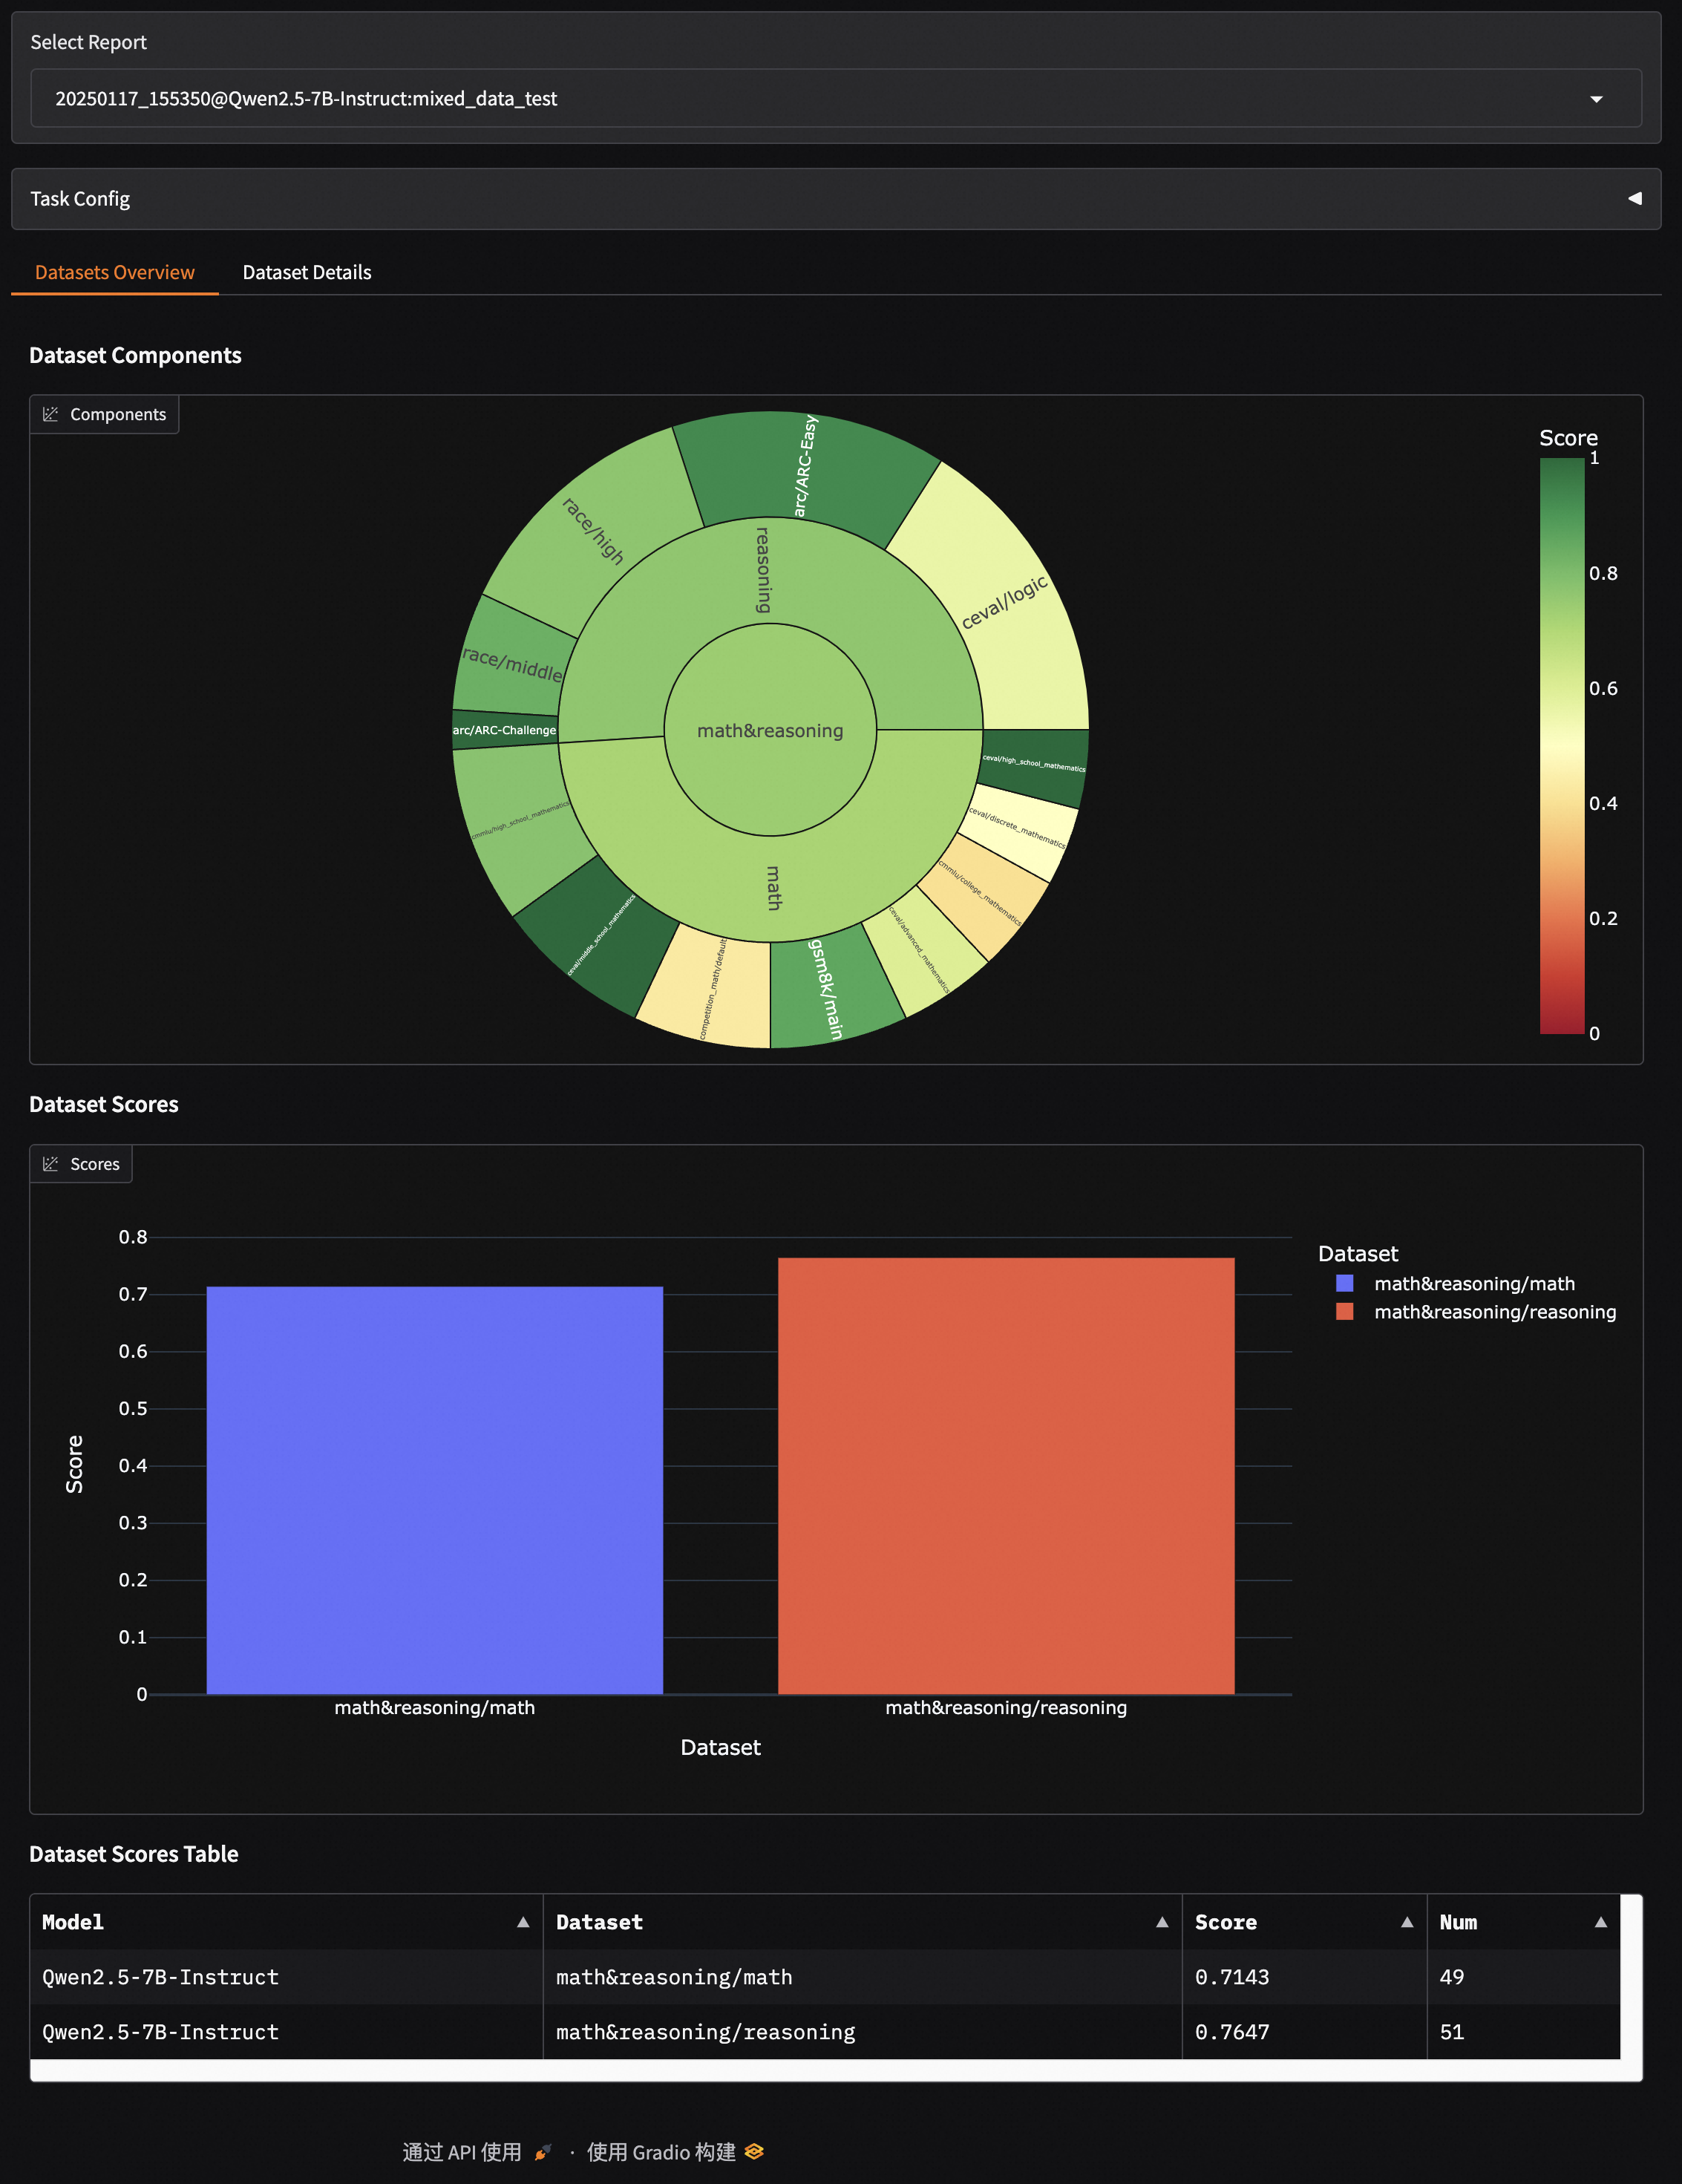
Mixed Dataset Evaluation Visualization#
This dashboard also supports visualization of mixed dataset evaluations, displaying results in layers according to your defined mixing structure (Schema).
For example, for a Schema with the following structure:
schema = CollectionSchema(name='math&reasoning', datasets=[
            CollectionSchema(name='math', datasets=[
               DatasetInfo(name='gsm8k', weight=1, task_type='math', tags=['en', 'math']),
               DatasetInfo(name='competition_math', weight=1, task_type='math', tags=['en', 'math']),
               DatasetInfo(name='cmmlu', weight=2, task_type='math', tags=['zh', 'math'], args={'subset_list': ['college_mathematics', 'high_school_mathematics']}),
               DatasetInfo(name='ceval', weight=3, task_type='math', tags=['zh', 'math'], args={'subset_list': ['advanced_mathematics', 'high_school_mathematics', 'discrete_mathematics', 'middle_school_mathematics']}),
            ]),
            CollectionSchema(name='reasoning', datasets=[
               DatasetInfo(name='arc', weight=1, task_type='reasoning', tags=['en', 'reasoning']),
               DatasetInfo(name='ceval', weight=1, task_type='reasoning', tags=['zh', 'reasoning'], args={'subset_list': ['logic']}),
               DatasetInfo(name='race', weight=1, task_type='reasoning', tags=['en', 'reasoning']),
            ]),
         ])
The visualization report will present a hierarchical structure consistent with the Schema:
math&reasoning
├── math
│   ├── gsm8k
│   ├── competition_math
│   ├── cmmlu
│   ├── ceval
├── reasoning
│   ├── arc
│   ├── ceval
│   ├── race